
A longitudinal look at changes in presidential voting from the Obama elections to the Trump elections
The roles of race, education, and religion in driving individual movement between the parties

In my last post, I used Cooperative Election Study (CES) data to compare group differences in turn-out and partisan shift moving through the 2008 to 2020 elections. Today, I take advantage of another good resource, a dataset containing actual longitudinal info where the same individuals were tracked over time.
The Views of the Electorate Research Survey, conducted by The Democracy Fund Voter Study Group with the help of YouGov, includes a sample of 8,034 individuals surveyed in 2011 and 2012, including reports of preferences/voting in the Obama elections from 2012 and 2008, where these same individuals were then surveyed again from 2016 to 2020, including reports of preferences/voting in the Trump elections from 2020 and 2016. So, we can get what should be a relatively good view of how folks who were potential voters in both sets of elections switched allegiances among Democrats, Republicans, and None of the Above.
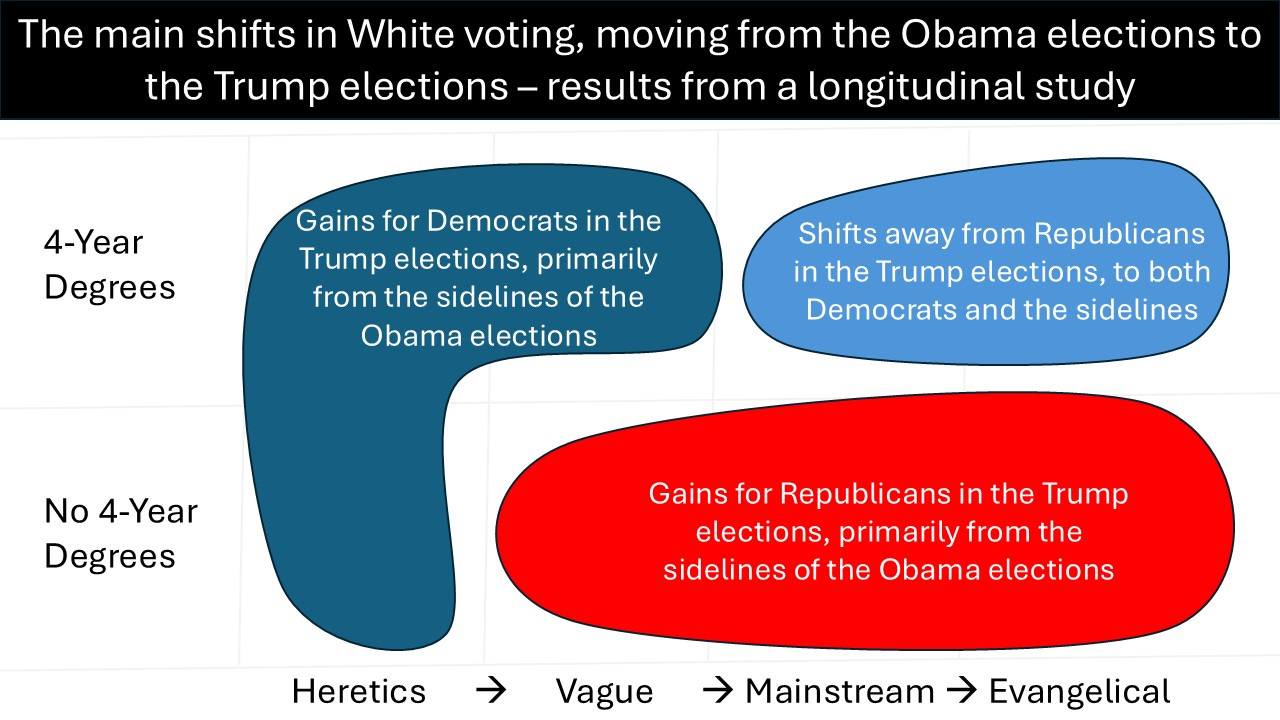
I’ll cut to the chase, then present details below. Here’s a summary of what happened with this sample as we move from the Obama elections to the Trump elections. In the aggregate, Blacks moved very slightly to the right and Hispanics/Asians hardly budged, while the bigger movements were among Whites, where:
Democrats gained support from more-educated and less traditionally religious folks, with the gains coming primarily from those who didn’t vote (or voted third-party) in the Obama elections;
Republicans gained support from non-degreed Whites, with the gains coming primarily from folks who didn’t vote (or voted third-party) in the Obama elections – other than explicit non-Christians (i.e., atheists, agnostics, Jews, etc.), who are in the category above that shifted further to the left; and
A number of Christians (both Mainstream and Evangelical) with 4-year college degrees didn’t so much flock to Democrats as they recoiled from Trump, either voting Democratic or sitting out the two-party contest.
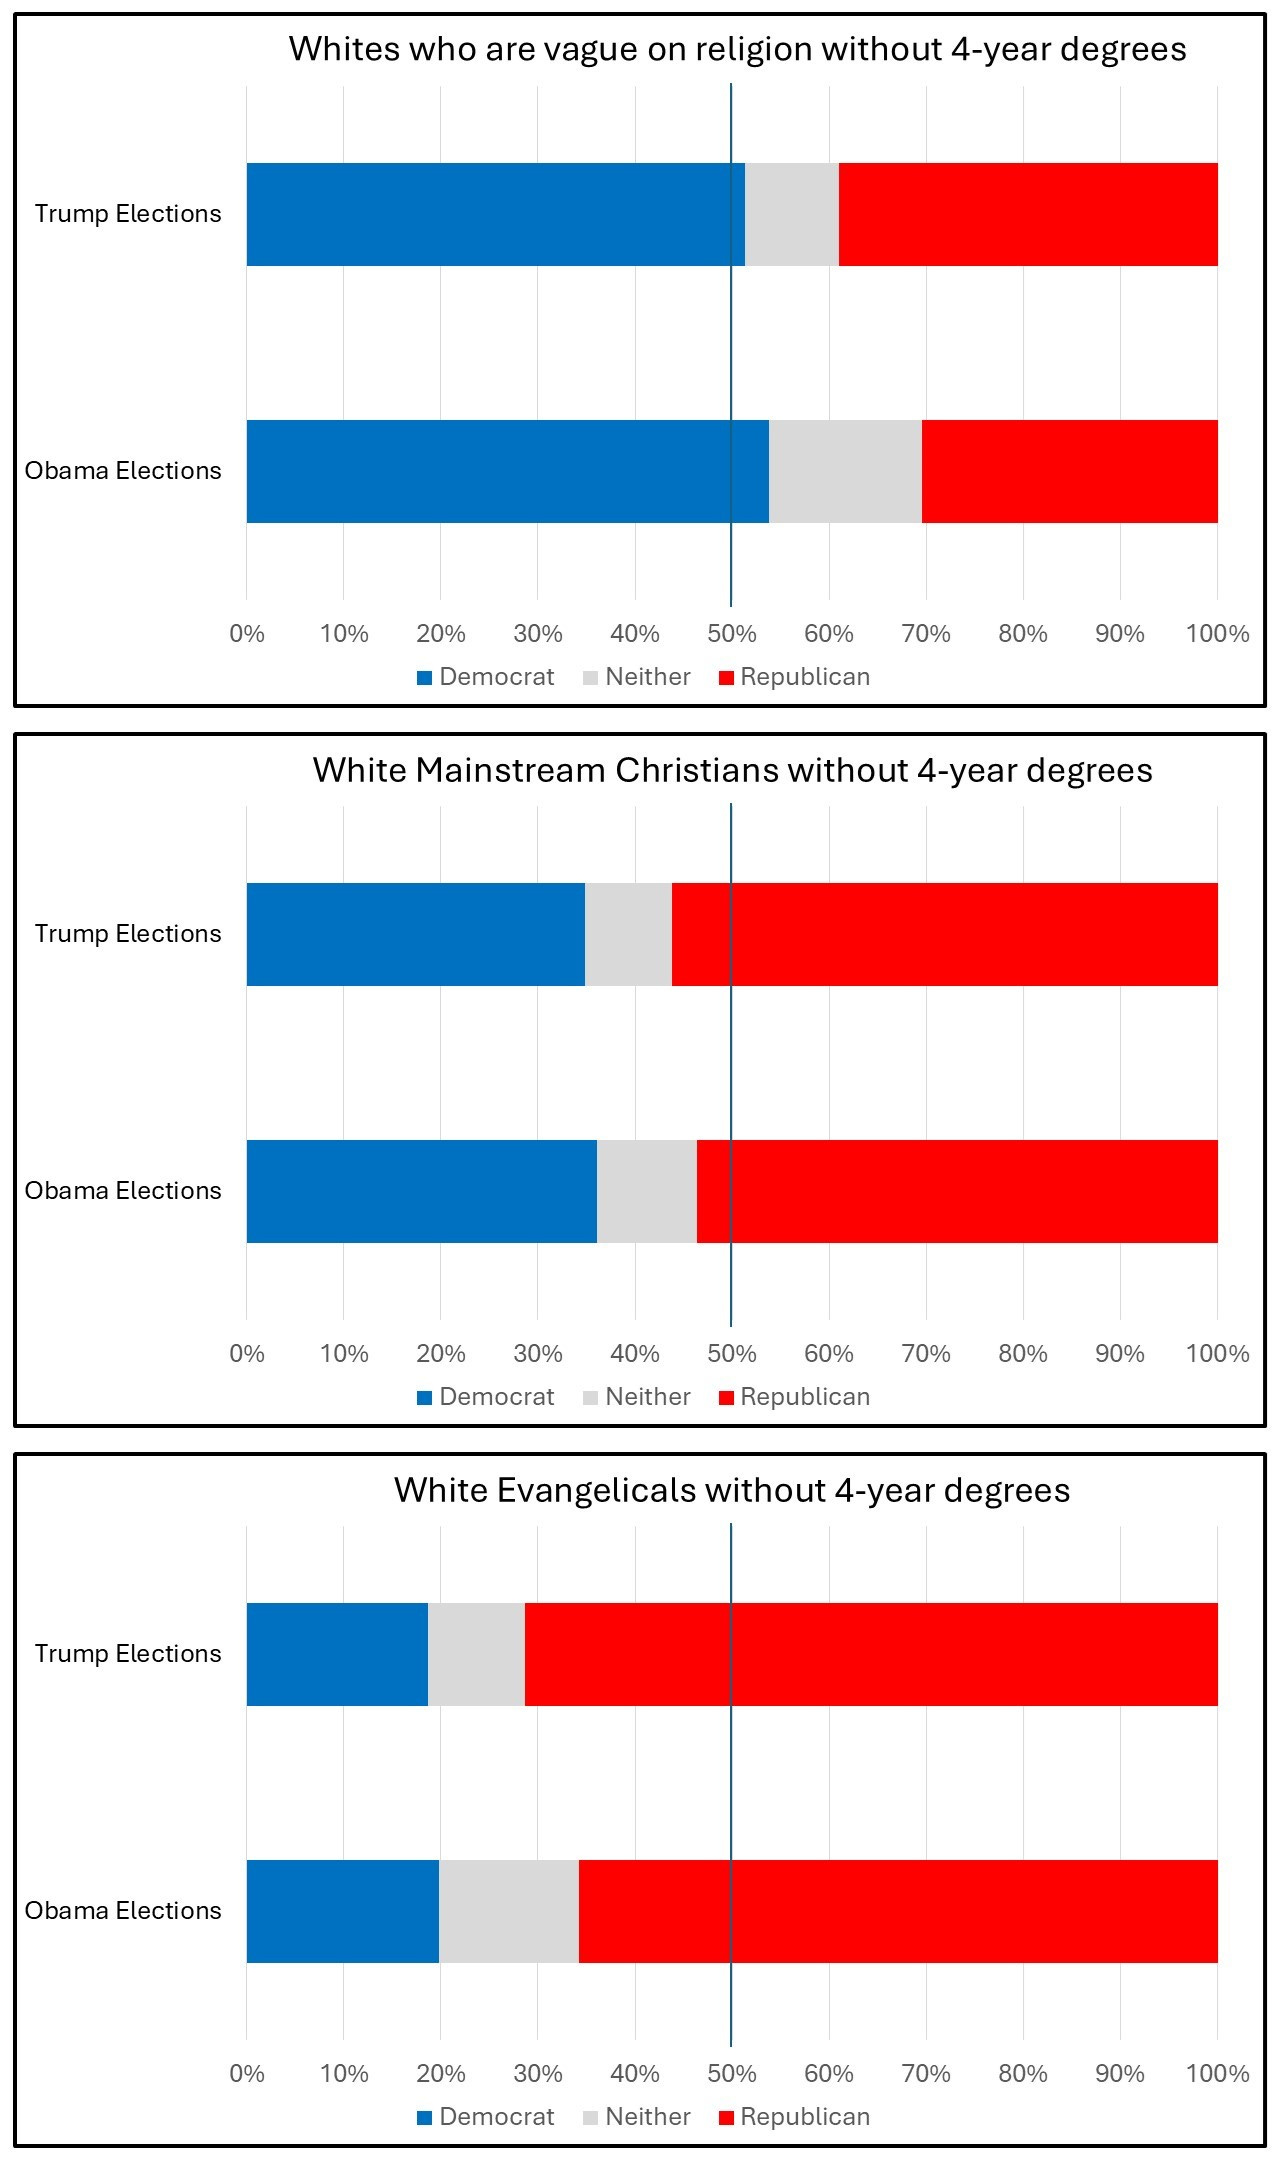
For this analysis, I divided the Whites in the sample by religion and education. The religion categories include (a) what I’m calling Heretics, who on my definition are all those who are explicitly not Christian (i.e., on religion, they chose atheist, agnostic, Jewish, Buddhist, or some other specific non-Christian option), (b) those who are vague on religion, selecting either “nothing in particular” or “other” (these folks include a mix of Christians and non-Christians), (c) Mainstream Christians, which includes all Catholics and all other non-evangelical Christians, and (d) Evangelicals.
So now let’s look at the details. Shown below, you can see (1) a very small shift to Republicans in the Trump elections for Blacks and (2) no apparent movement for Hispanics/Asians. This is consistent with what we saw in my previous post using CES data.
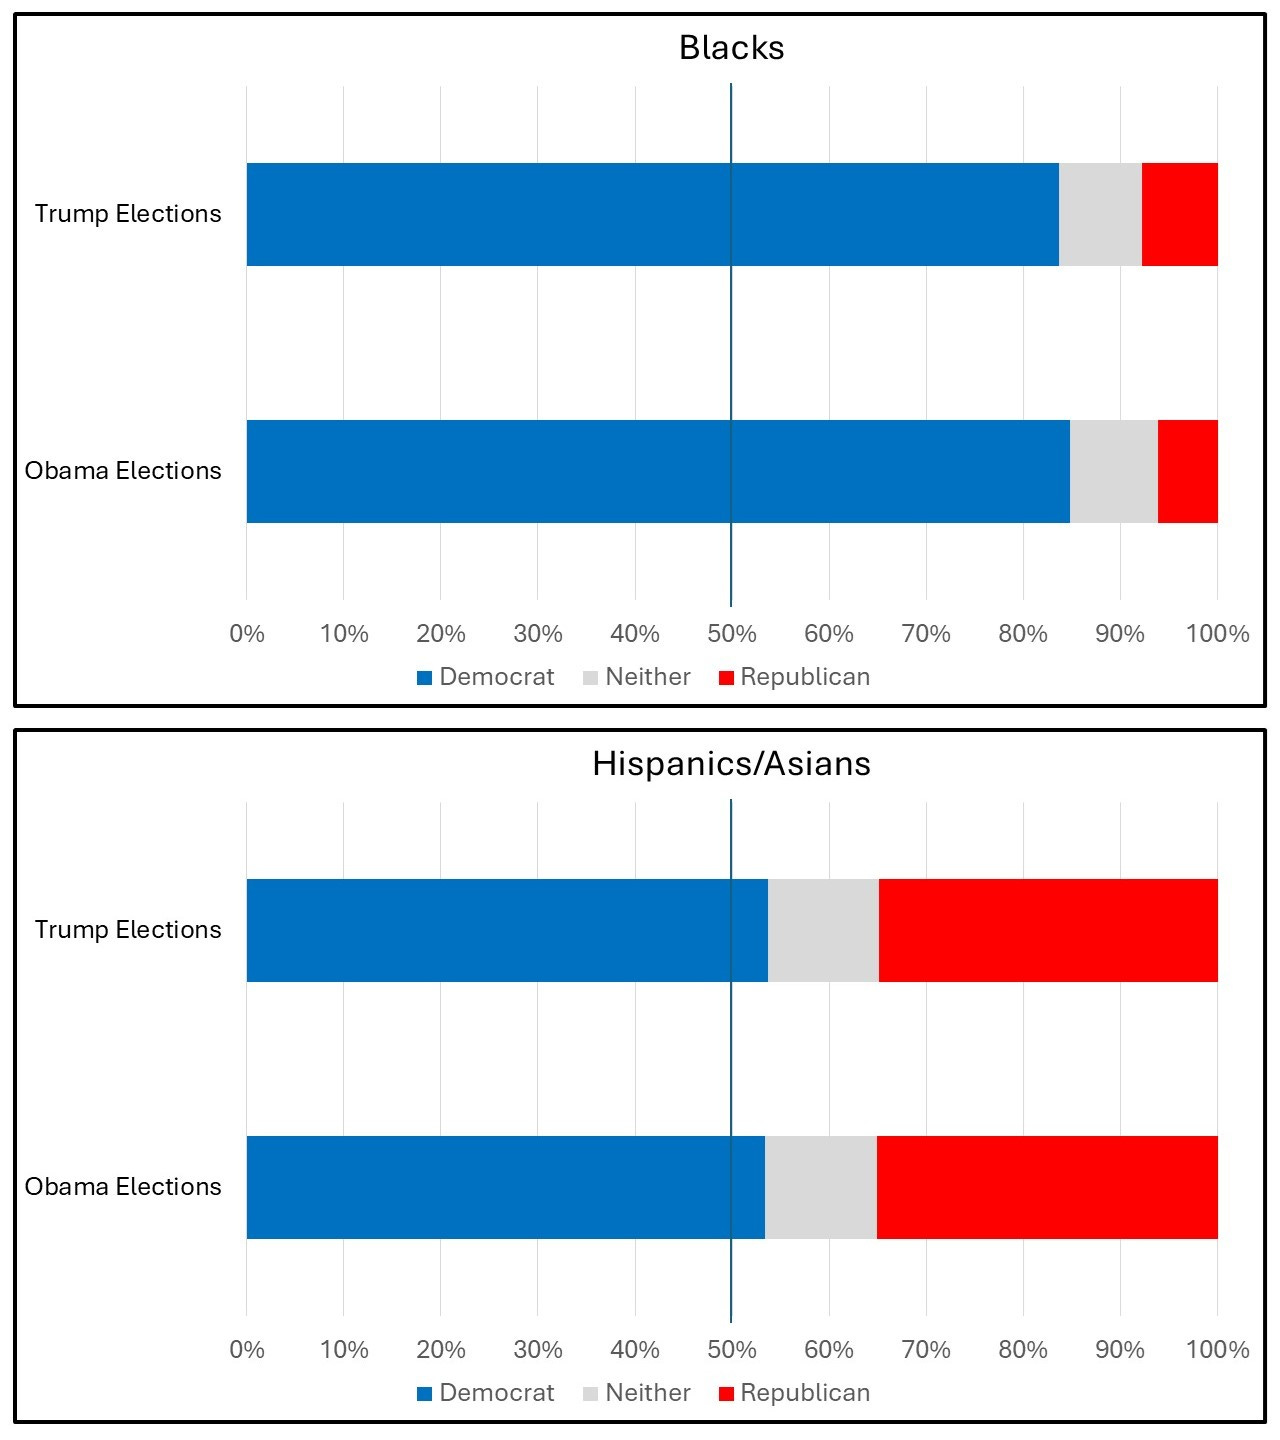
This relative stability at the aggregate level masks a surprising degree of movement underneath. Overall, 14% of the Black sample and 21% of the Hispanic/Asian sample reported a different category (Democratic vote vs. no two-party vote vs. Republican vote) when comparing their choice in the most recent Obama election from the surveys in 2011 and 2012 to their choice in the most recent Trump election from their 2016 to 2020 surveys. Some of this is noise – the respondent accidentally choosing the wrong option, or the data-entry folks making a typo, or some breakdown in the process leading to different individuals taking the earlier and later surveys, or some respondents trolling the survey-takers, or bots, or whatever – so you shouldn’t take the 14% and 21% numbers too literally. In the charts, we’re looking at aggregate margins where, hopefully, noise points tend to cancel each other out on average, allowing the signal to be detected.
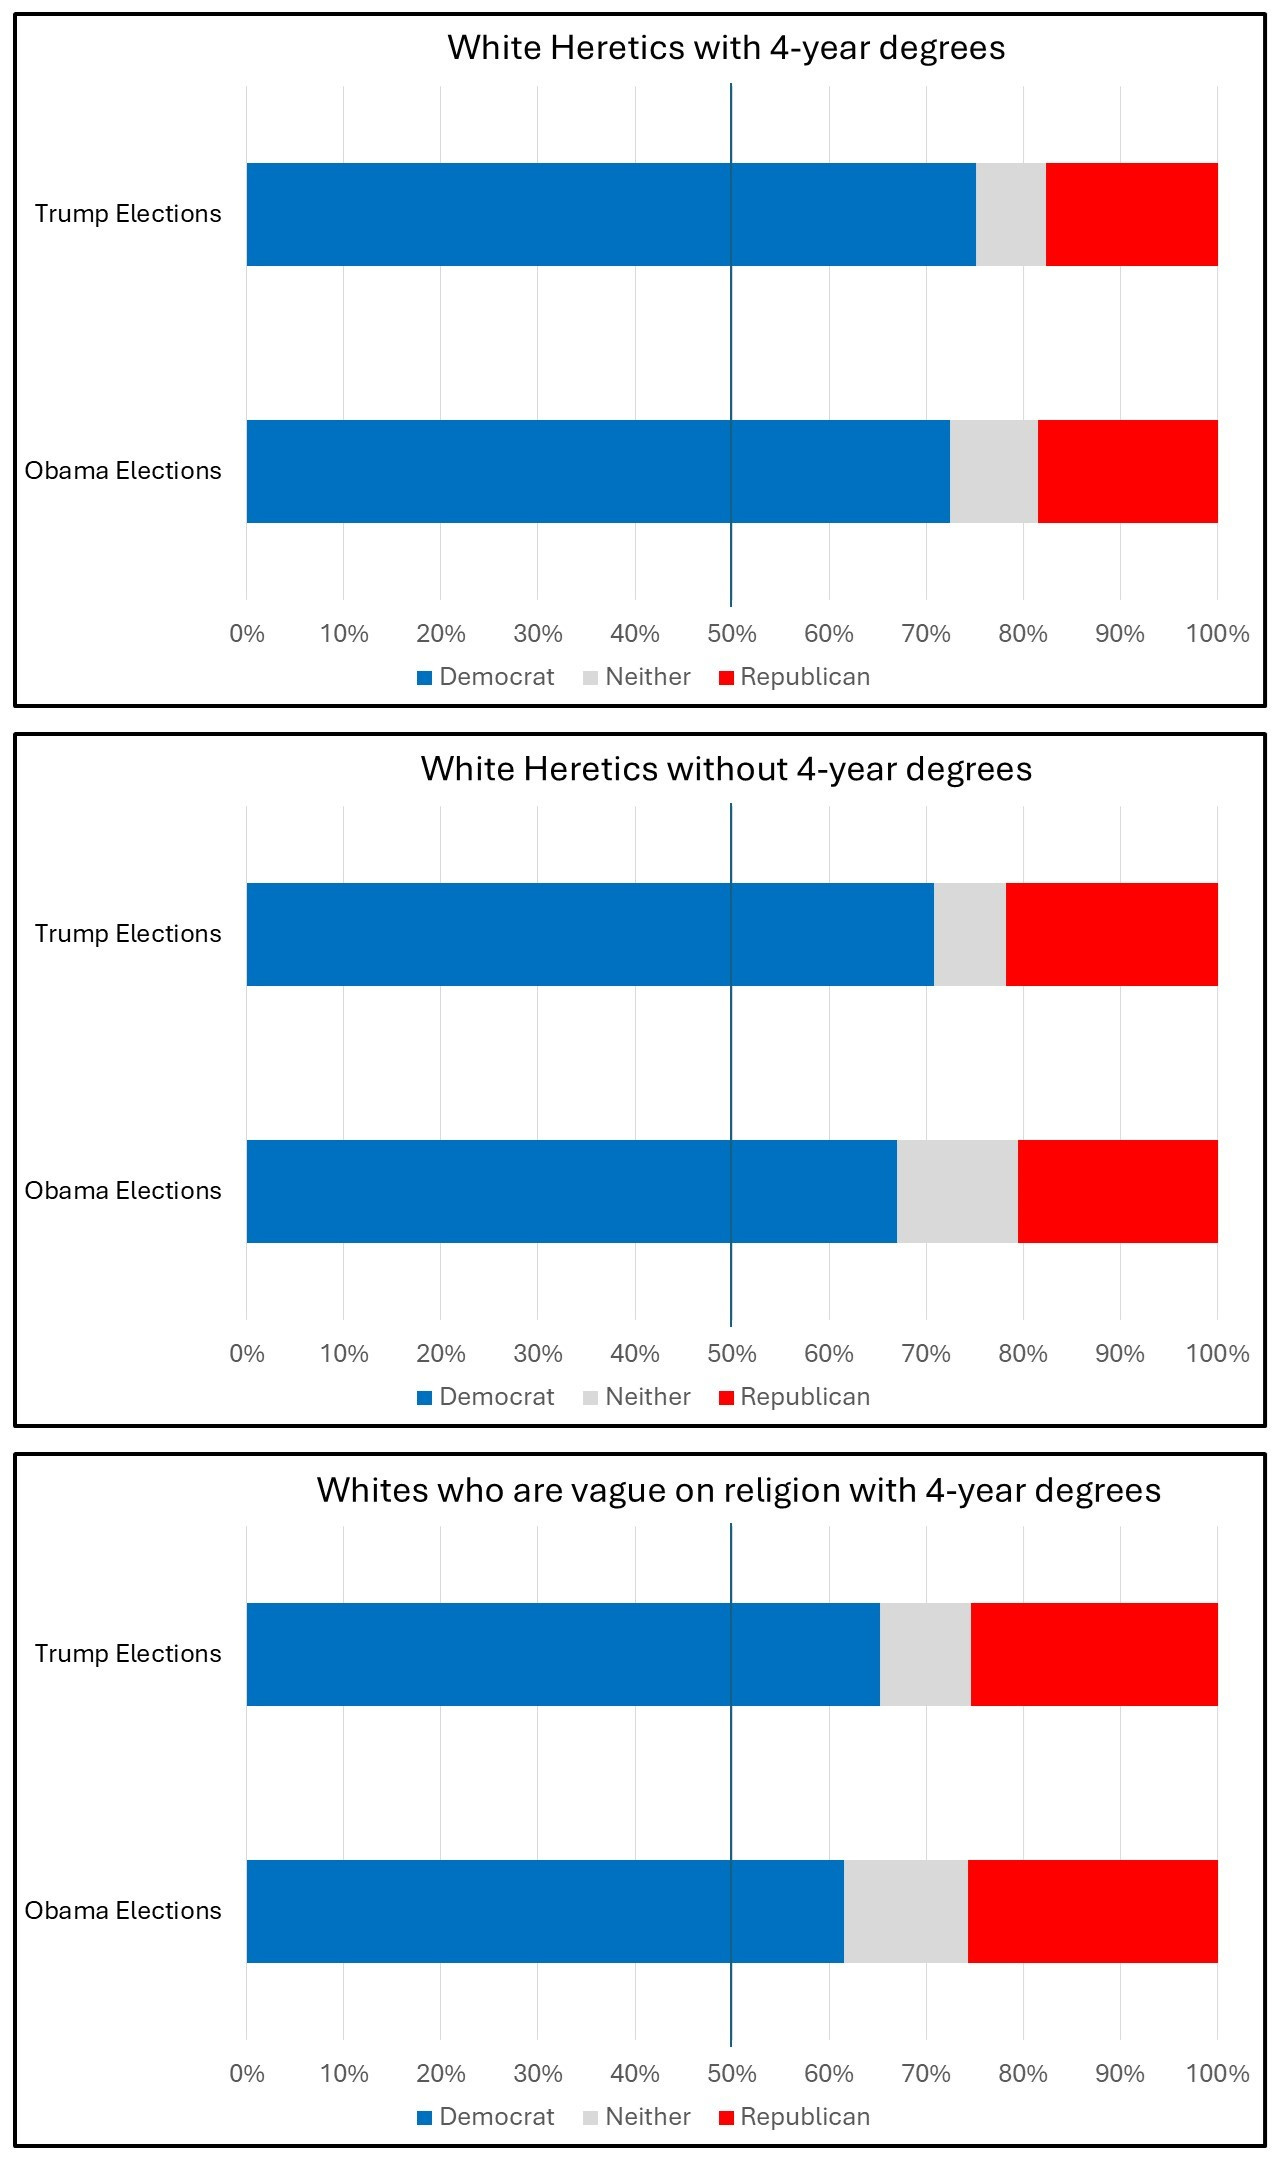
The next slide shows the White groups where on the whole Democrats gained voters in the Trump elections, with these gains coming primarily from people who had not voted (or voted for a third party) in the Obama elections. This category includes White Heretics (both college-degreed and not) along with degreed folks in the vague “nothing in particular” or “other” territory. Overall, around 3% of these folks in the aggregate landed on Democratic Voter rather than “Neither” when comparing the two sets of elections. The percentage landing on Republican Voter remained essentially unchanged. So, on the whole, this was a pretty modest shift. Again, this aggregate stability masks a much higher rate of category shifting underneath, with 16% of these respondents changing between Democratic, Republican, and Neither (but see my noise caveat above).
Next we look at White Christians with 4-year degrees. With these groups (again, on net) we see a small decline in Republican voting – the Mainstream folks went from 51.6% in the Obama elections to 46.3% in the Trump elections (a 5.3 point drop) while among Evangelicals it was 73% down to 66.7% (a 6.3 point drop). Put another way, within both groups, Republicans lost more than 10% of their voters. About half of the Republican ship-jumpers (again, on net) came ashore in the Democratic camp and about half in the Neither camp.
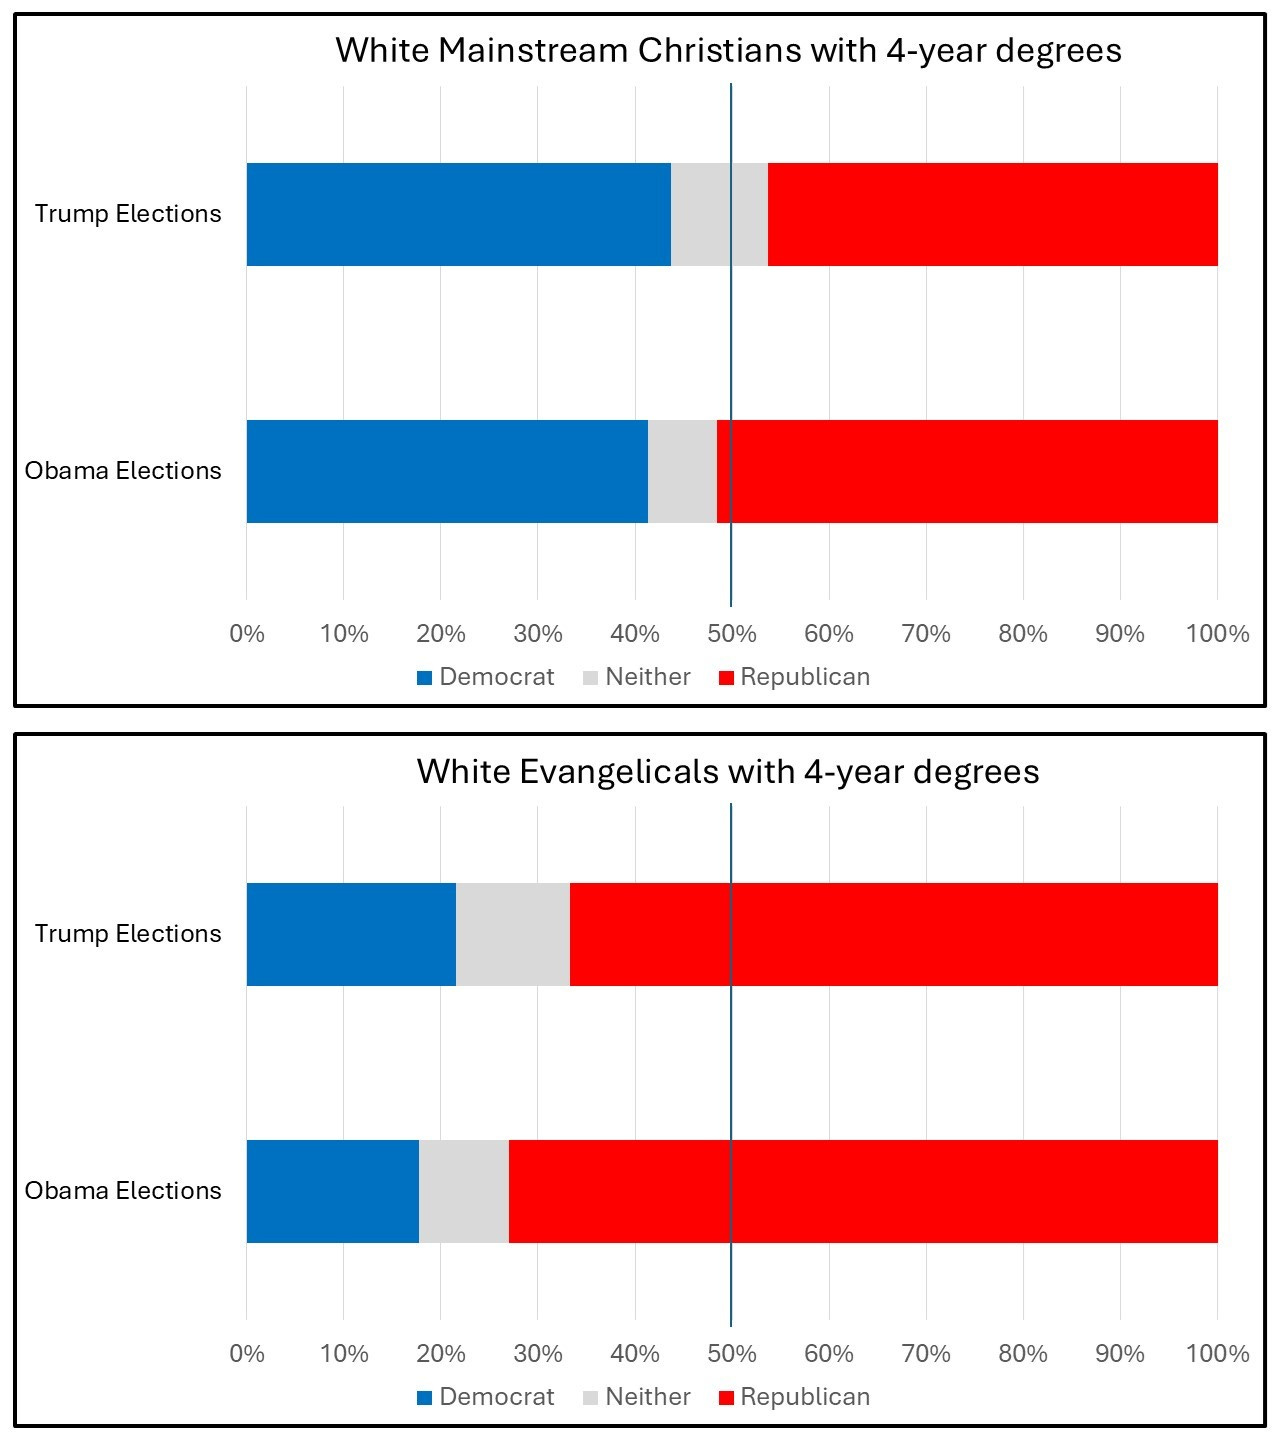
Of note, these were the only 2 groups in which the rate of two-party voting declined over time. Usually as folks get older, two-party voting rates increase. These educated Christian groups, however, seem to have been faced with a tougher choice on average that pushed a number of them to the sidelines.
Lastly, we look at the White groups that shifted to Republicans – namely, most Whites without college degrees (other than the Heretics covered earlier). For these less educated Christians and “nothing in particular” or “other” folks (again, many of which are actually Christians), there was an aggregate 4.8 point rise in Republican voters. This Republican gain was fed by a 3.3 point drop in Neither and a 1.5 point drop in Democratic voters.
So add this to the data pile. It’s not the full or end-point of the story – just another piece of evidence. Lots of things should make you skeptical about the exact numbers here, but I find the same general story popping out across analyses, and it’s not novel or surprising: The Trump realignment has involved some combination of Whites who are less-educated and more traditionally religious moving towards Republicans and/or away from Democrats, while Whites who are more-educated and less traditionally religious have moved towards Democrats and/or away from Republicans.
These shifts likely arose in large part because Trump has altered the Republican Party’s policy priorities. It was previously a party primarily focused on the economic priorities of wealthy White Christian men, secondarily focused on the sexual and reproductive priorities of White churchgoers, and neither fully comfortable with nor fully rejecting of the desires of many less-educated Straight White Christians for reduced immigration and a return to traditional forms of group-based discrimination against racial minorities, non-Christians, and LGBT folks.
Trump deprioritized economic matters, at least rhetorically (though in the end supporting large tax cuts for the wealthy and trying to eliminate the ACA), he gave the churchgoers their judges, and he opened the cultural floodgates on traditional discrimination (e.g., such that it’s currently not disqualifying to claim that Black and Brown immigrants are diseased insects infecting the blood of our country). These were moves that were tailor-made to attract certain low-education Whites, and the moves worked, though at the expense of losing significant numbers of college-educated Whites.
Trump appears to be doubling-down on that strategy in this cycle, while Harris tries to maximize the costs of Trump’s maneuver by moderating on economics to attract more college-educated White Christians – some of whom, as we saw earlier, moved from Republican to Neither in the prior Trump elections, and perhaps just need a further nudge to head all the way over to Democrat.
More to come!