
How does the political gap between young women and men compare to past years?
The wide gaps of the late 80s and 90s narrowed in the past two decades, but may be widening again.

You might have heard that the political gender gap among young folks is currently getting bigger. That might be true, but it hasn’t popped out at me while looking at data from the last few years, and at any rate it’s one of those things that’s a bit tricky to nail down.
For the 2024 election, I consulted the consortium exit polls, the Voter Analysis results, and CES’s online pre-election projections. It’s not super convincing that there even really was a youth gender gap in 2024 that was importantly wider than the gender gap for older folks. There might have been, but those sources aren’t very consistent on that point—it only really shows up in the smallest of the three samples, which also had the most slicing and dicing.
I’m getting ready for the new samples on the 2024 election that should start arriving around March (from CES, ANES, etc.), and I decided to try to get a clearer sense of the youth gender gap: Leading up to the 2024 election, had it been expanding? How does the current gap relate to past gaps?
I’ve been putting together a very large political dataset, combining publicly available GSS, ANES, CES, PRRI, and other reputable sources into one consistently coded file. Here, I focused on people ages 18 to 29, plotting averages of party identification (a 7-point measure from strong Democrat (=1) to strong Republican (=7)) and self-labelled ideology (a 5-point measure from liberal (=1) to conservative (=5)) separately for women and men in every sample in the dataset.
The chart below shows what young folks’ party ID has looked like over the past 50 years. The blue dots are men and the pink dots are women. The sizes of the dots relate to sample size. Numbers above 4 are Republican-leaning on average; numbers below 4 are Democrat-leaning on average.
Moving from left to right, you can see that young women were maybe a little more Democrat-leaning than men in the late 70s, but the gap really goes big in the 80s and 90s (when more young men identified as Republicans), and then it shrinks back in the late aughts and 2010s.
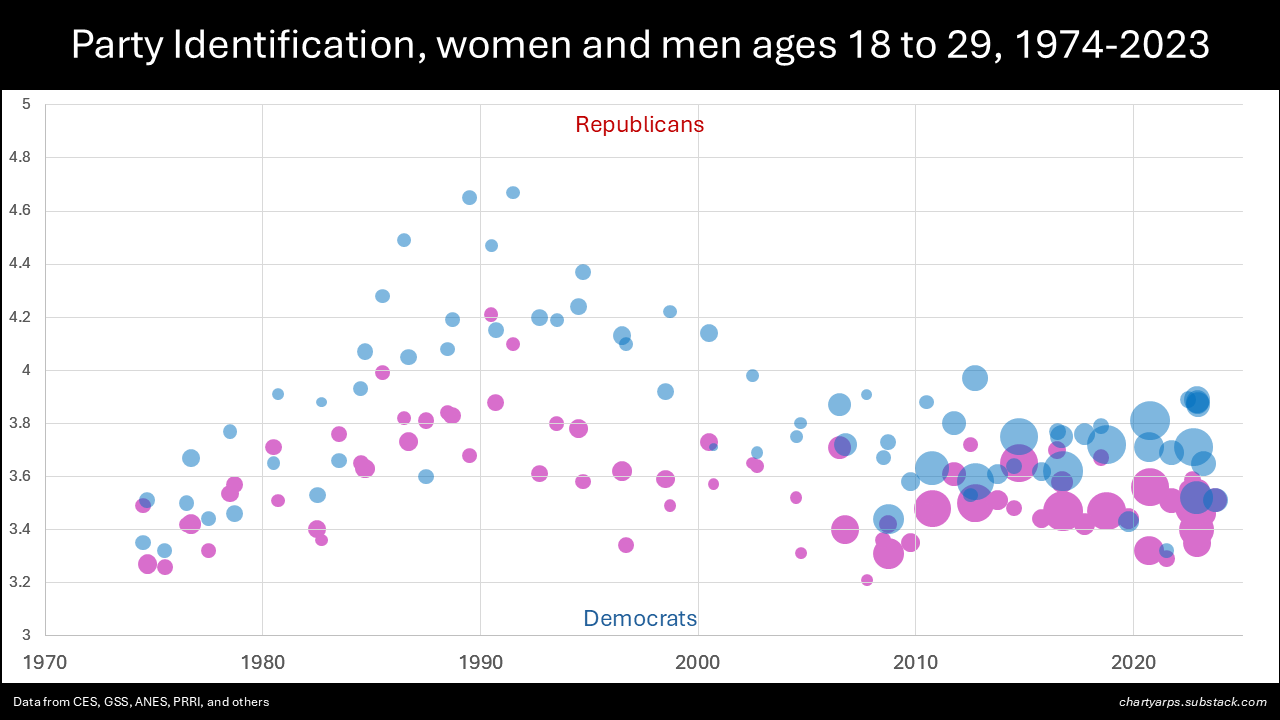
Has it gotten wider recently? Well, I’ve only got data through mid-2023 (it takes a while for folks to make the good stuff publicly available), so I can’t yet cover what happened in 2024. But, yeah, it looks as though it might have been widening a bit in the past 10 years. But then the very most recent sample (the 2023 CES) has really no gender difference at all in party ID for 18 to 29 year-olds. So, you know, it’s just not very clear.
I ran the same kind of chart for self-labelled liberal/conservative ideology, and it shows essentially all the same patterns over time, as would be expected. Here’s that:
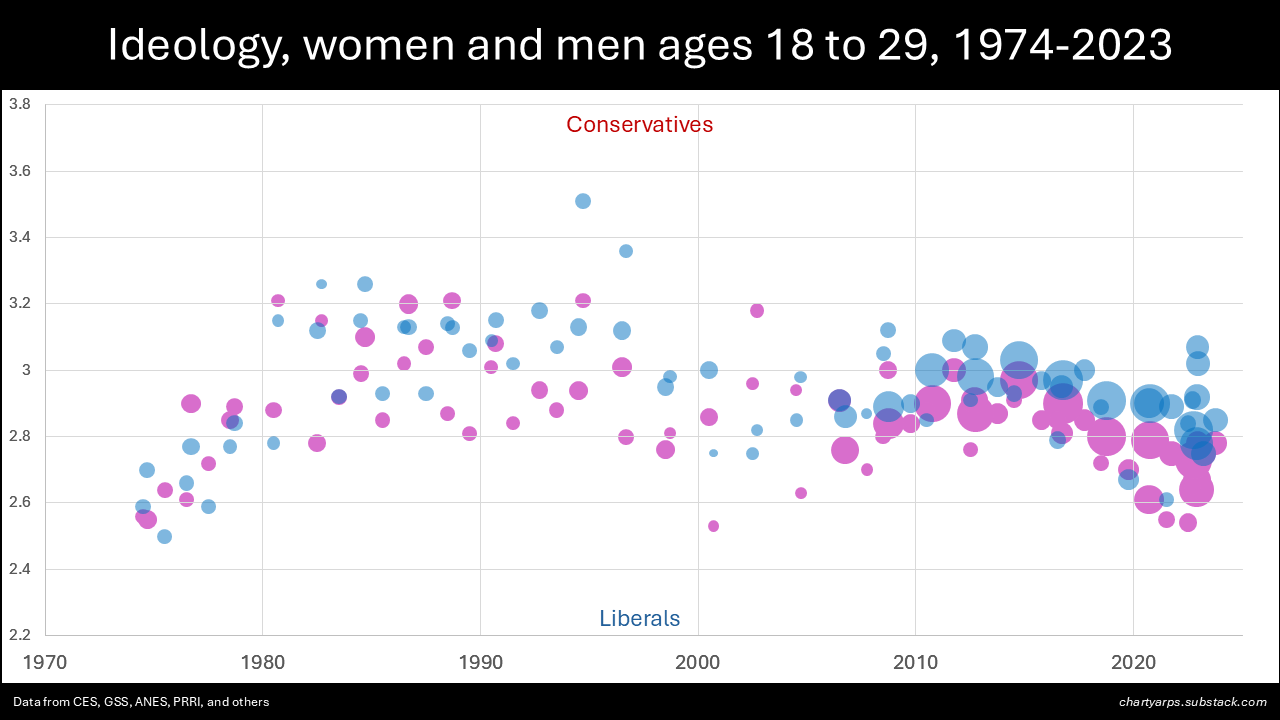
So, I don’t know. These differences are pretty subtle. Age gaps and gender gaps have never tended to be large in comparison with race, sexual orientation, and religion gaps, which have been the main demographic political divisions in the past 40 years—and the education gap has for sure become much wider since 2016.
I’m going to continue to be skeptical of the claim that there is an important new gender gap among young people. I do think it “feels right” given the vibes and whatnot. Maybe, as Noah Smith has suggested, we’re entering a kind of new 1980s. I’ll know a lot more in a few months.