
Introducing a Nine-Group Typology of Early Millennial Women’s Relationships and Childbearing
Looking at different levels, sequences, and mixes of hook ups, marriage, education, children, etc.

I’m investigating the broad patterns found in different approaches to sex, relationships, and having children among the most recent generation of U.S. women who are just now coming to the tail end of typical ages of childbearing — the early Millennials currently entering their 40s.
The data come from the National Longitudinal Survey of Youth 1997 (NLSY97), which is a study that began in 1997 and has repeatedly surveyed individuals who were in their teens in the initial survey waves and who in the most recently available wave from 2021 were in their late 30s and early 40s.
This study has a tremendous amount of detailed information on education, partying, sexual activity, marriages and cohabitations, number of children, family incomes, etc., collected consistently over time from the same individuals. This provides a unique look at not just where these women have ended up so far, but also the sequenced lifestyle patterns that led to where they are today.
Here’s what I did to kick things off. I limited the NLSY97 sample to women who had provided survey answers at least every few years from their mid-teens to late 30s. I pulled age-specific information on these women’s educations (level achieved and whether in school), alcohol and marijuana usage (which I refer to below as simply “partying” for brevity), sexual activity (whether sexually active at that time, number of recent partners, and frequency of sex), whether then married or cohabiting with a partner, number of biological children, body-mass index (BMI), household income (as a percentage of the federal poverty level), and frequency of church attendance. I grouped these into three-year averages, starting with age 15 (which is based on an average of responses at ages 14 to 16), age 18 (average of ages 17 to 19), and so on.
So the prepped data consists of things like:
Whether the woman had been in school at ages 15, 18, 21, 24, 27, 30, and 33.
The number of drinks the woman had per month at those ages (the NLSY97 stopped asking about alcohol consumption in its later years).
Whether the woman was married or cohabiting with a partner at ages 18, 21, 24, 27, 30, 33, 36, and 39.
Whether the woman had given birth to a child in the past 3 years at those ages.
And so on.
I then analyzed all that information simultaneously using a clustering algorithm that automatically groups the sample into discrete batches of individuals who have similar statistically linked features overall. I tried different numbers of clusters and different sorting mechanisms and finally settled into one that produced nine typology groups that, to my mind, seem varied enough to capture the major underlying themes without overly complicating things.
A couple of key limitations. First, the NLSY97 primarily relates to heterosexual relations. For women, the study questions were mostly limited to asking about activities with men, and that’s what I report here. Second, you don’t want to push too hard in extrapolating what we find here beyond early Millennial women in the U.S. – for example, I’m confident that any similar study of women born in the 1930s or the late 1990s, or of early Millennials in Japan or India, etc., would produce very different group patterns. Some readers will want to interpret this as “there are nine kinds of women in the world” … but that’s not what this is.
I’ll give an overview of a couple of the nine typology groups that I found in the NLSY97 in this post, and get to the rest in later posts. For background, in prior work on religiosity and on public opinion on reproductive and lifestyle issues, I’ve defined “Freewheelers” as people who have more sex partners, less-committed relationships, fewer kids, and so on. In contrast, I’ve defined “Ring-Bearers” as the don’t-fool-around-much, get-and-stay-married, have-lots-of-kids types. These categories turn out to be useful short-hand descriptions for a number of the group patterns that were produced by the clustering process for the NLSY97 women. I also use the standard acronym “SES” for socioeconomic status, where people with more education and higher incomes are high-SES while those with less education and lower incomes are low-SES.
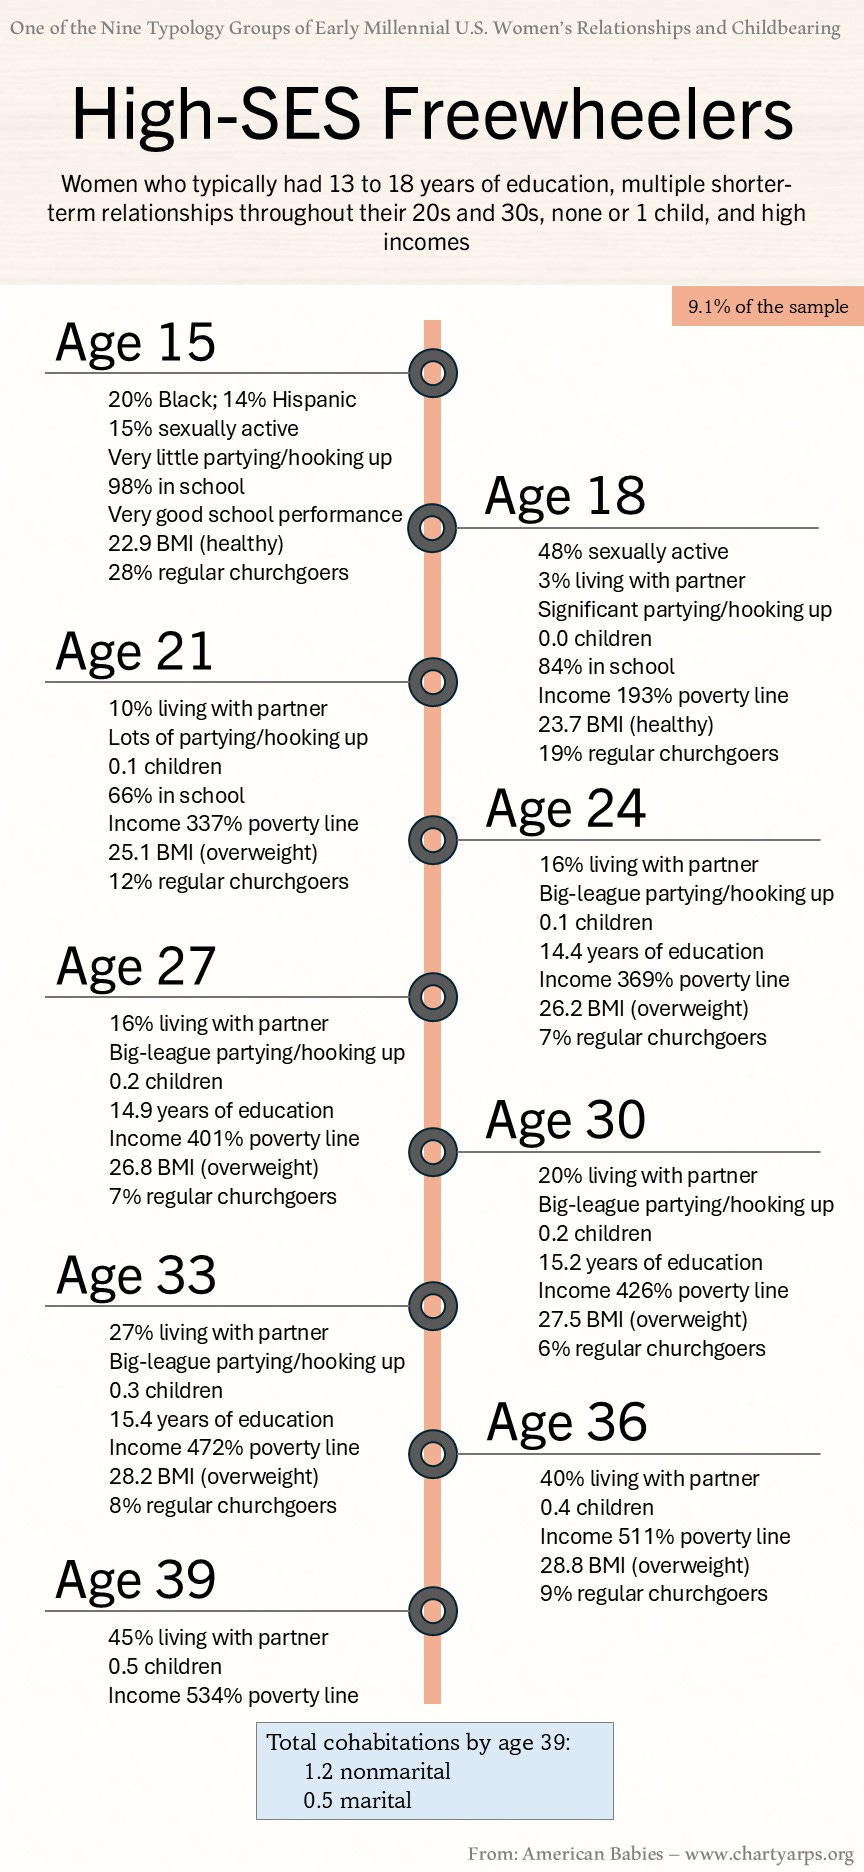
High-SES Freewheelers:
Consistent with the definitions I just gave, this typology group consists of women who typically at least attended college, probably got a 4-year degree, and maybe got a grad degree, who had multiple shorter-term relationships throughout their 20s and 30s, who had no children or maybe one child by age 39, and who had higher incomes, particularly in their late 20s and 30s. These are essentially the central characters from Sex and the City, though more economically, geographically, racially, and physically diverse.
In combining a Freewheeler pattern with a high-SES pattern, these are women who ended up partying and hooking up a lot, but didn’t tend to start with that until their late teens and early 20s. Around age 15, very few were sexually active, they really weren’t partying or hooking up, and they were doing well in school – virtually indistinguishable in those regards from their high-SES peers in other typology groups who would go on to more traditional adult patterns.
Another product of combining high-SES and Freewheeler patterns is that these women had very few children in the end. High-SES patterns involve delayed childbearing and not having children to an extent that would overly reduce one’s standard of living. Freewheeler patterns involve favoring shorter-term relationships over the longer-term ones that tend to produce higher numbers of children. So, when these patterns combine, the result is most often no children at all.
Below are some details of the High-SES Freewheeler pattern, presented in timeline format. For most items, I report straight forward numbers. The key place where numbers wouldn’t be too helpful involves my description of “partying/hooking up” – here, I’m describing a combination of items involving level/frequency of alcohol consumption, marijuana usage, having high numbers of sex partners, and having sex with people you just met. You know, partying and hooking up. Anyway, I combined these into an overall measure such that the final numbers aren’t meaningful (except that higher means more overall and lower means less overall). For my quick descriptions of partying/hooking up, I created six levels, from lowest to highest: Very little, little, some, significant, a lot of, and big-league.
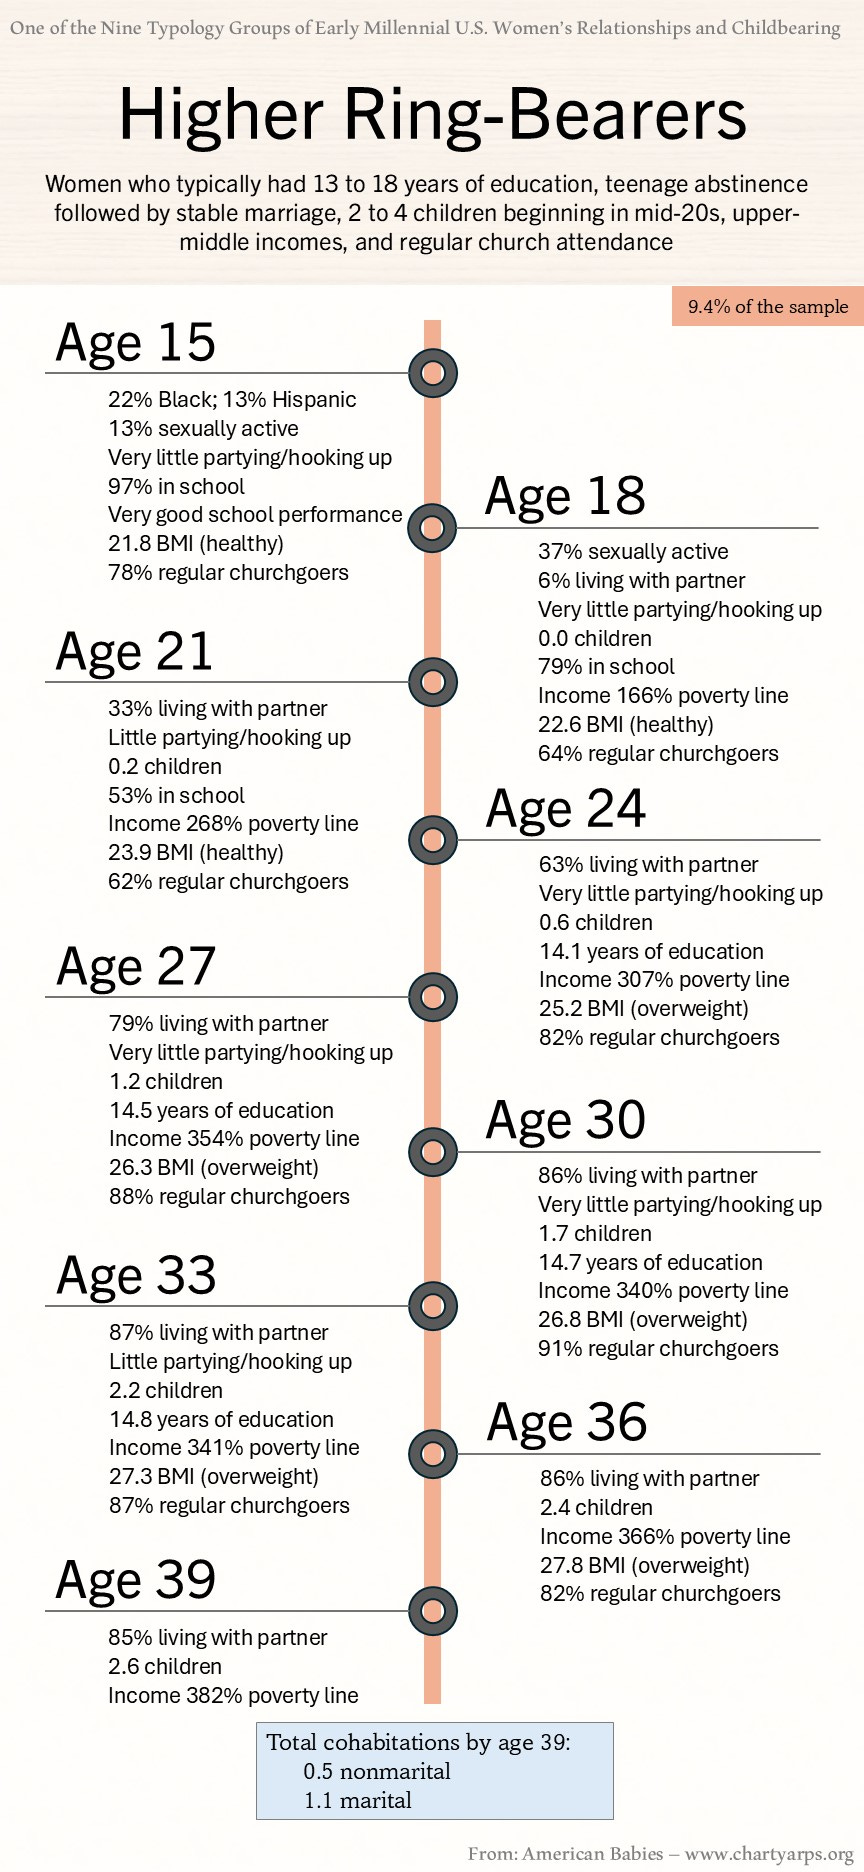
Higher Ring-Bearers:
Like High-SES Freewheelers, these Higher Ring-Bearers typically were behaving themselves and doing well in school in their mid-teens, and then at least attended college, probably got a 4-year degree, and maybe got a grad degree. In sharp contrast, though, Higher Ring-Bearers tended to share a pattern marked by very little partying/hooking up, delayed sexual activity while in high school and college, followed quickly by stable marriages and relatively high numbers of children — with 2 or 3 by age 39. This typology group contains many of the sample’s regular churchgoers.
The Higher Ring-Bearers, however, have had somewhat lower standards of living than High-SES Freewheelers so far in their adult years – in their 30s, the former had family incomes around 350% of the poverty line while the latter had family incomes around 490% of the poverty line. It’s important to keep in mind that the poverty line changes based on household composition, which is crucial in translating raw incomes into more of a measure of how comfortably a family is able to meet its needs. On 2024 federal standards, for example, the poverty line for a family of 1 is $15,060 a year while the poverty line for a family of 5 is $36,580. A family of 1 at 490% of the poverty line would have $73,794 a year in income. A family of 5 at 350% would have $128,030 a year. So, when I say “high incomes” as a brief description, I really mean “high standard of living from income relative to household composition” – or something like that.
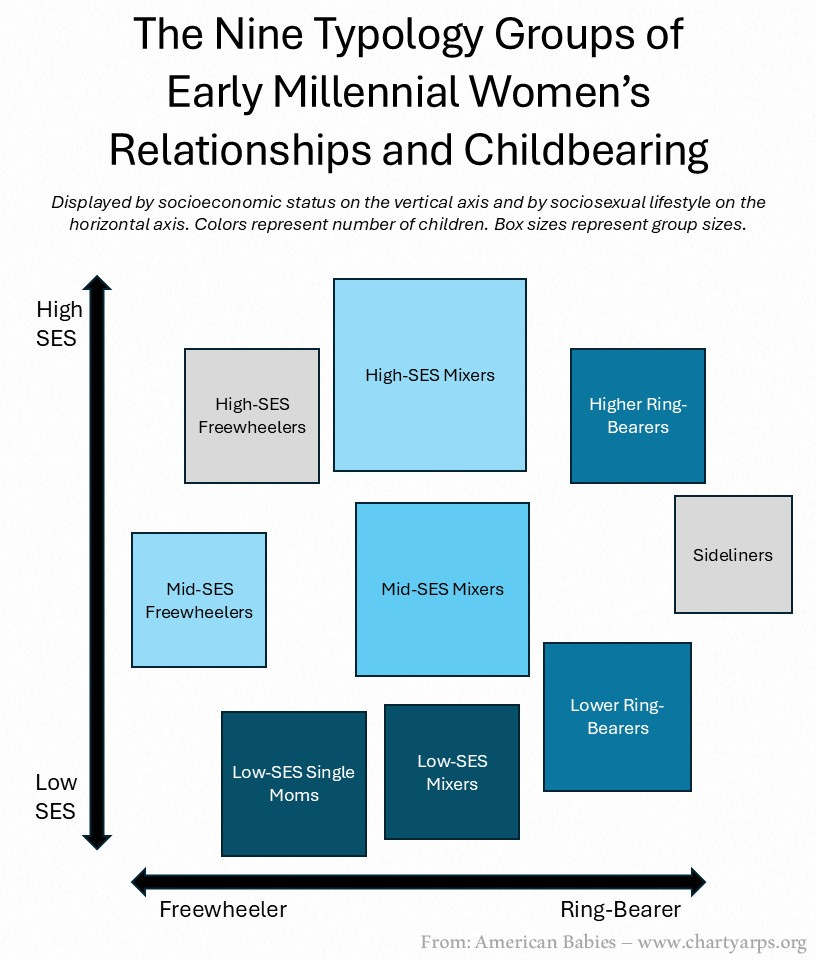
That’s enough for today. I’ll get to the other seven groups soon! For now, I’ll leave you with a little conceptual chart below of how all nine typology groups fit together, as a map to where this project is heading. As I’ve been discussing, I think a good way to initially process the diverse patterns in these data is in terms of high vs. low SES on one axis and Freewheeler vs. Ring-Bearer on the other. I’m using the term “Mixers” to describe typology groups where women tend to combine shorter-term and longer-term relationships over their lives – e.g., when we look at High-SES Mixers, you’ll see a familiar pattern of women who partied through college but transitioned to marriage and children in their late 20s.
This two-factor framework breaks down a bit at low-SES levels where some additional constraints make the Freewheeler/Ring-Bearer distinction less apt, which I’ll cover later. There’s also the “Sideliner” typology group, which consists of women who largely sat out the mating game entirely, which adds a kind of “none of the above” option to the usual sociosexual framework – I’ll talk about this later as well.
In the chart, the colors of the boxes represent number of children by age 39, with darker blues indicating the highest averages (for Low-SES Mixers and Low-SES Single Moms) and the grey boxes represent minimal childbearing (for High-SES Freewheelers and Sideliners).
More to come!