Introducing Charty Arps
Exploring social science data

What to expect
I’m Jason Weeden, a retired lawyer and social science researcher. You can search for my academic publications on Google Scholar. I’ll be exploring some of the standard big publicly available datasets, posting about my incremental progress, and storing the findings over at my chartyarps.org website. I’m not going to have any paid content and won’t be following any particular schedule of releasing updates — I’m just doing what I enjoy and inviting you to check it out occasionally if you find any of this interesting.
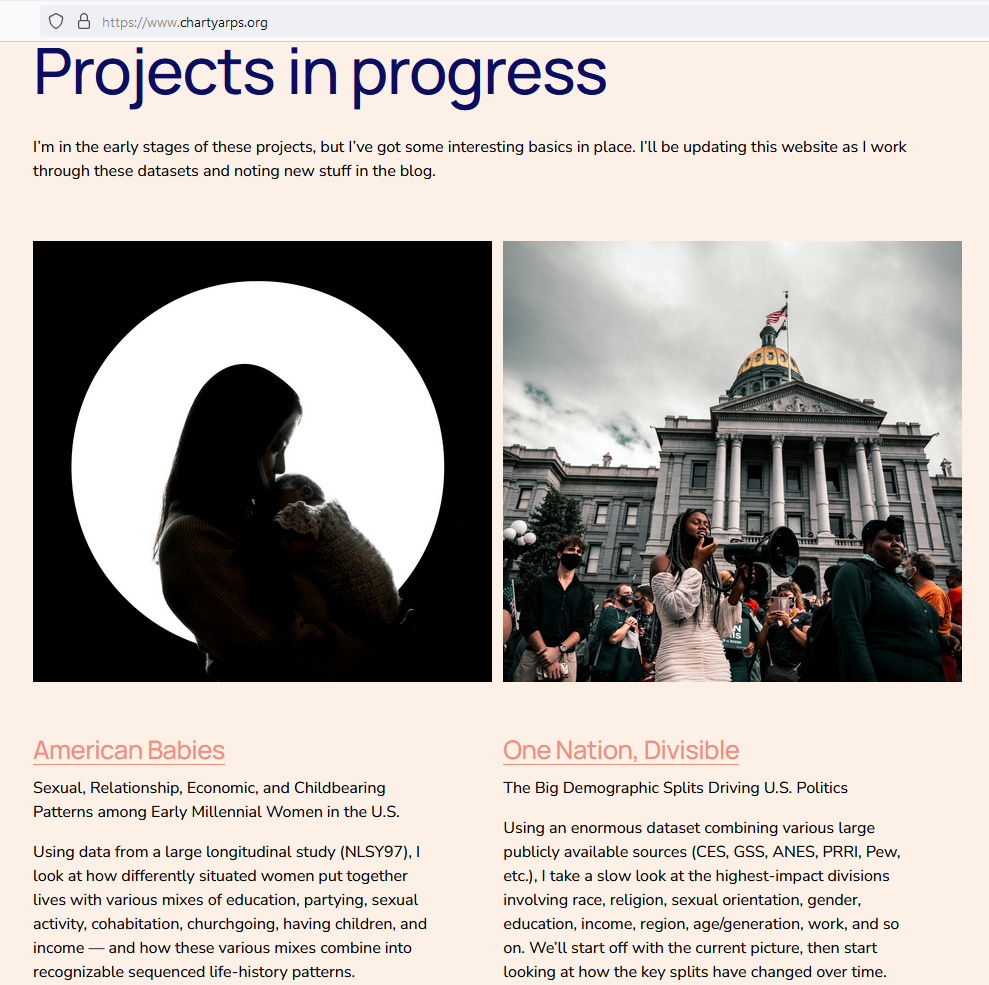
First projects - American Babies
I’ve got two datasets going right now. One is the National Longitudinal Survey of Youth 1997. This study is following a group who were in their teens in 1997 and are now entering their 40s. It provides a great opportunity to look at the various life-history patterns in the modern U.S. — from professionals who initially focus on extended educations and higher incomes and then have 1 or 2 kids in their 30s, to the classic underclass pattern of teen childbearing with 3 or 4 kids but very low incomes, to those who party and hook up like crazy when young and have a couple of kids conceived and raised within a string of relationships, to religious conservatives who follow an extended period of abstinence with stable marriages and 2 to 3 kids, and more.
I’m starting by looking at the basic patterns among women, will move next to what is highly predictable and essentially unpredictable in those patterns based on available info about their parents and their childhoods, and will eventually look at men as well. At some point I’ll probably look at the National Survey of Family Growth to see what it adds to the picture.
First projects - One Nation, Divisible
The other dataset I’m putting together is an amalgam of the big political surveys, including available data from CES, GSS, ANES, PRRI, and other sources. So far my dataset contains over 200,000 surveys from 2020 to 2023. It provides a unique opportunity to really drill down in detail on the demographics of political differences. Currently, I’m putting together a flowchart of the highest-impact demographic splits driving party affiliation and voting. The key lesson so far: Around two-thirds of the Democratic coalition are people who are racial minorities and/or explicitly non-Christian (i.e., atheists, agnostics, Jews, Buddhists, etc.) and/or LGBT. In contrast, around two-thirds of Republicans are simultaneously White and Christian and straight cisgender binary.
As we keep going with demographic splits, we’ll see important differences based on education levels, generations, gender (and gender-related stuff like gun ownership and military service), and more. Once we’ve traced through the current state of play, I plan to add older data and look at the details of what’s changed in the past 20+ years.
Trying to understand and communicate big things
For the kinds of big-picture questions that interest me, my approach is to assemble as much high-quality data as I can get, to include as many variables as I can manage, to continually focus on the plausibility of my assumptions about what causes what, and in a real sense to let the data take it from there — focusing in on the largest predictors, looking at the patterns of mediation, identifying the fissures and clumps as they exist — without trying to prove any particular hypothesis or tell any particular story. I’m confident that I’m pretty good at that.
And then I’m also trying to describe what I find in understandable and engaging ways. I’m not confident that I’m very good at that. So I’m likely to play around with how I’m presenting things and putting it all together. I plan on using some combination of the website for the big picture and Substack for episodic stuff and interesting side quests. It will always be a work in progress, and I’d be glad to get suggestions about new tech I might try (e.g., I’ve recently discovered Flourish, which is great), or different approaches in breaking out pieces of the larger story, or whatever else could make the project better.
Where things stand right now
I’ve got the beginnings of both the American Babies and the One Nation, Divisible projects up on chartyarps.org, including some data visualizations. As I said, I’m not going to monetize this or sell anything, and I’m not going to hold myself to any particular schedule — but this is fun for me, so there will likely by at least weekly updates unless I’m reconfiguring a new dataset or something, which can take weeks of all work and no play before being analysis-ready.
Looking forward to plugging away and getting to the good stuff — thanks!