
Offspring Surviving to Adulthood in the U.S. since the 1800s
An estimate of both levels and distributions of surviving offspring over time.

When looking at historical fertility levels, it’s crucial to keep in mind that most fertility measures are derived from number of live births. But in discussions of the possible future implications of current fertility levels (as well as evolutionary discussions of reproductive success), folks usually have in mind something more like how many adult descendants people are producing rather than number of births per se.
These days in the U.S., less than 2% of children born alive die before reaching adulthood, and so number of births can be taken as roughly equivalent to number of likely adult descendants. But if you go back to the 1800s and before, pre-adulthood death rates are above 10% and can even approach 50%. Indeed, one of the commonly cited reasons for why women birthed more babies in the past than they do today is that infant/child mortality rates used to be much higher. If you assume, for example, that most women on average essentially are trying to have 2 or 3 surviving offspring, then you’d expect them on average to birth 3 or 4 babies when the pre-adult death rate is around 30%.
What are the historical trends in numbers of adult descendants? In my last post, I showed levels and distributions of completed fertility (as measured by number of live births) going back to the early-mid 1800s. Here I provide my attempt to adjust those numbers for likely death rates, showing estimates of numbers of offspring surviving to adulthood (OSTA) for the cohort groups I used last time.
I came up with death rates by comparing a few different sources (U.S. census data on surviving children from 1900 and 1910, current and historical government data on age-specific death rates, online sources where I couldn’t quite figure out where they ultimately came from but that looked like legitimate good-faith numbers, etc.) and just kind of came up with numbers that seemed roughly consistent with most of that. I’d welcome better estimates if anyone has them. Here’s what I came up with: I estimate that, for women who were born from 1835 to 1854 who were having children in the mid-late 1800s, the percentage of their children who died before roughly age 19 was around 30%. My estimate for the women born from 1875 to 1887 was that 19% of their kids died before adulthood. For women born from 1902 to 1913, 9%. For women born from 1927 to 1938, 4%. For women born from 1946 to 1964, 2%. I further assume that each child born had an equal chance of dying, that is, that the individual odds of death for a kid whose mom birthed 10 kids was equal to the odds of death for a kid whose mom birthed only that one child. I don’t know if that assumption is importantly wrong, perhaps more so for some time periods than others.
So take all this with a grain of salt. At any rate, here we go.
The first chart below shows estimated outcomes for women born in the early-mid 1800s who did most of their birthing in the late-mid 1800s (before the lightbulb was invented in 1879, which is why I’m calling them the Pre-Lightbulb Women, to emphasize a range of technologies that weren’t yet prevalent). In my prior post, we saw that these women ended up having around 4.9 babies on average. Assuming a 30% death rate pre-adulthood, that leaves us with an average of around 3.4 offspring surviving to adulthood (OSTA).
The chart shows graphically what the distribution of OSTA would look like if you imagine this group as having 10 women, where each woman represents her decile. I’m trying to convey how tremendously variable fertility outcomes have been within groups, not just how the overall averages shift over time.
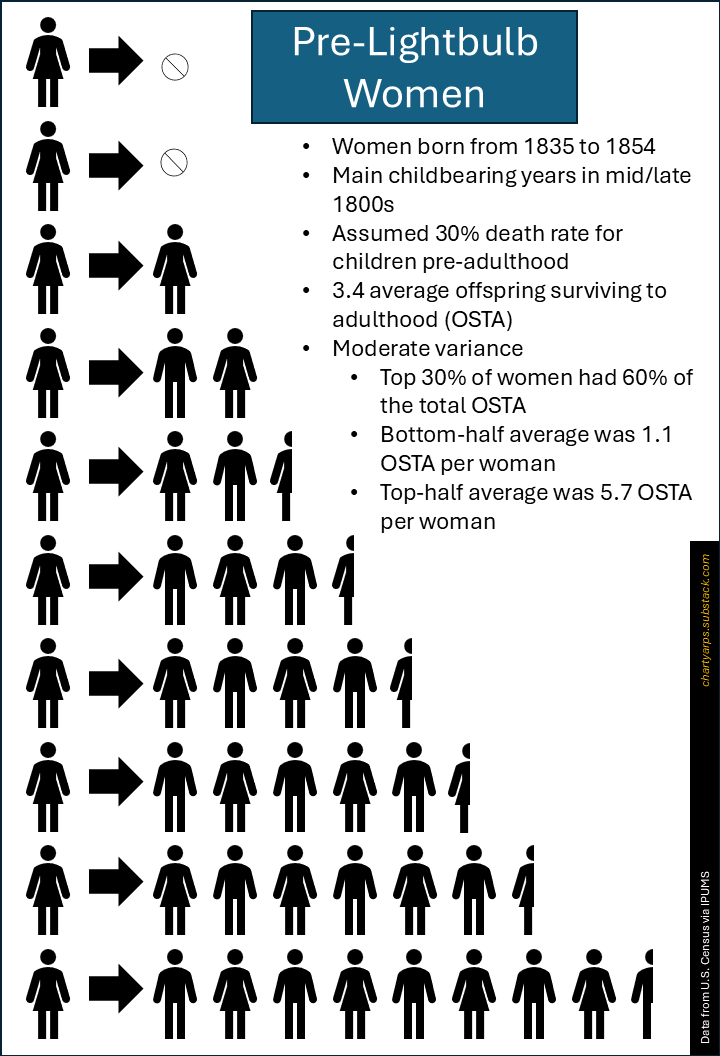
Because I’m assuming that deaths were equally likely in larger and smaller families, the distribution stats for the OSTA here are similar to my prior post on births. For the oldest group above, we see middle levels of variance, with the top 30% of women having 60% of the OSTA and with the top half having a bit over five OSTA for every one OSTA the bottom half ended up with.
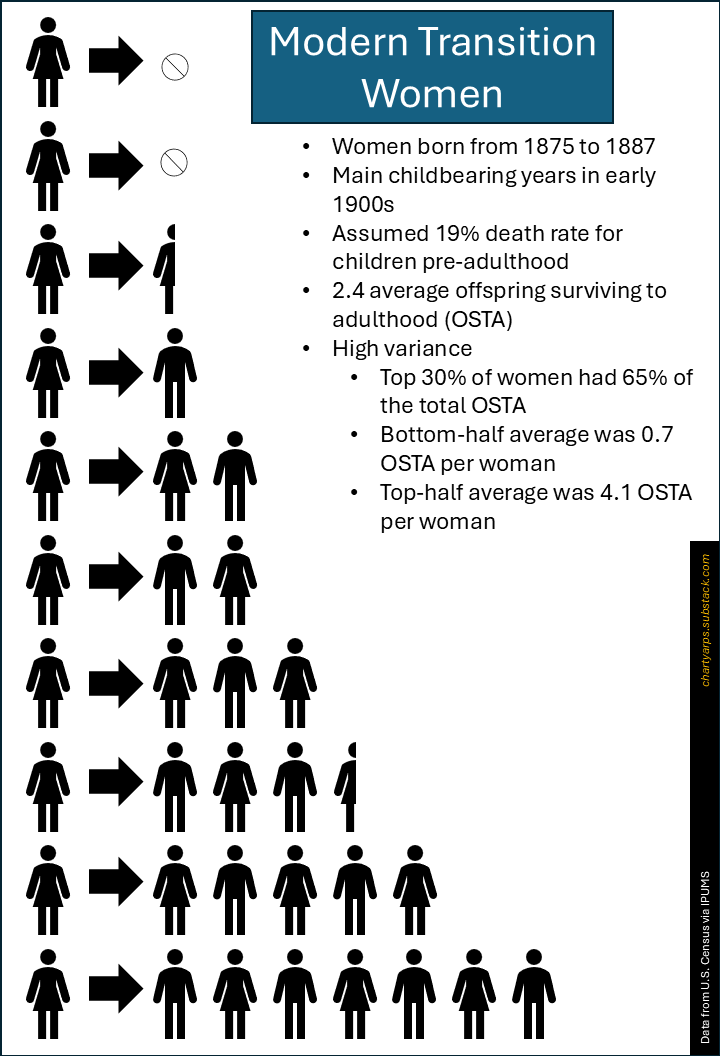
Next are the women born from 1875 to 1887, who did the bulk of their childbearing in the early 1900s. Assuming a 19% death rate pre-adulthood, the 3.0 babies we saw in the prior post become 2.4 OSTA in the chart below. As we saw last time, this is a high-variance group, with the top 30% having 65% of the OSTA and with the top half having a bit over almost six OSTA for every one OSTA the bottom half ended up with. About a quarter of women in this group had no OSTA.
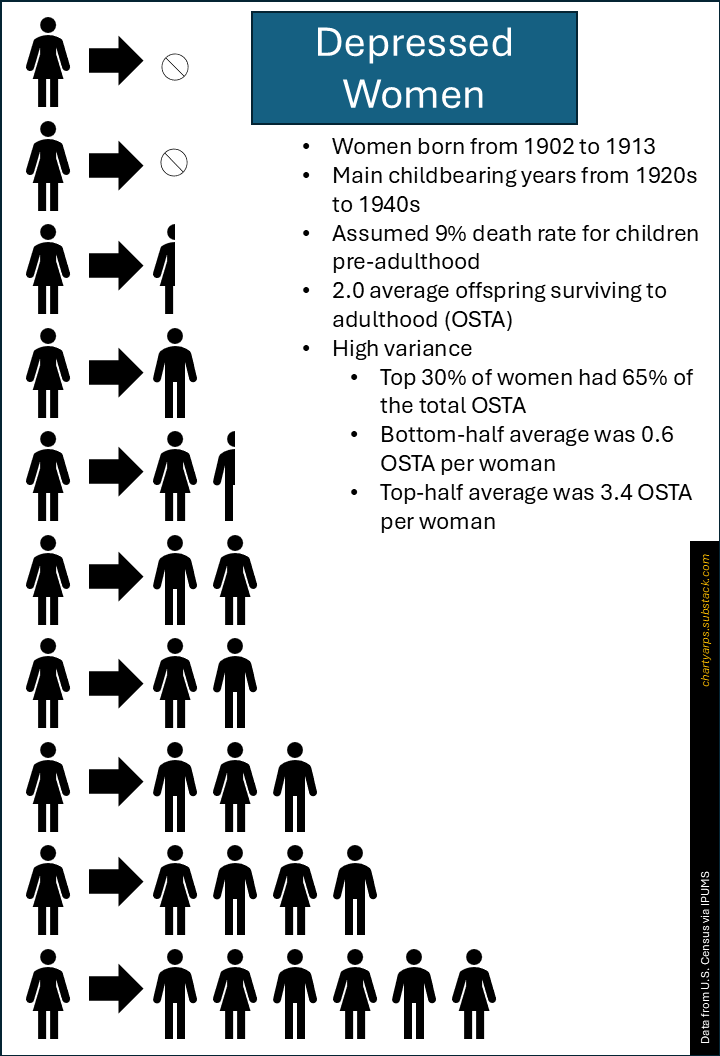
For the women who did the bulk of their childbearing from the 1920s to the 1940s—a period dominated by the Great Depression—I estimate below that their average OSTA was 2.0, and that they had the same high variance as the prior group.
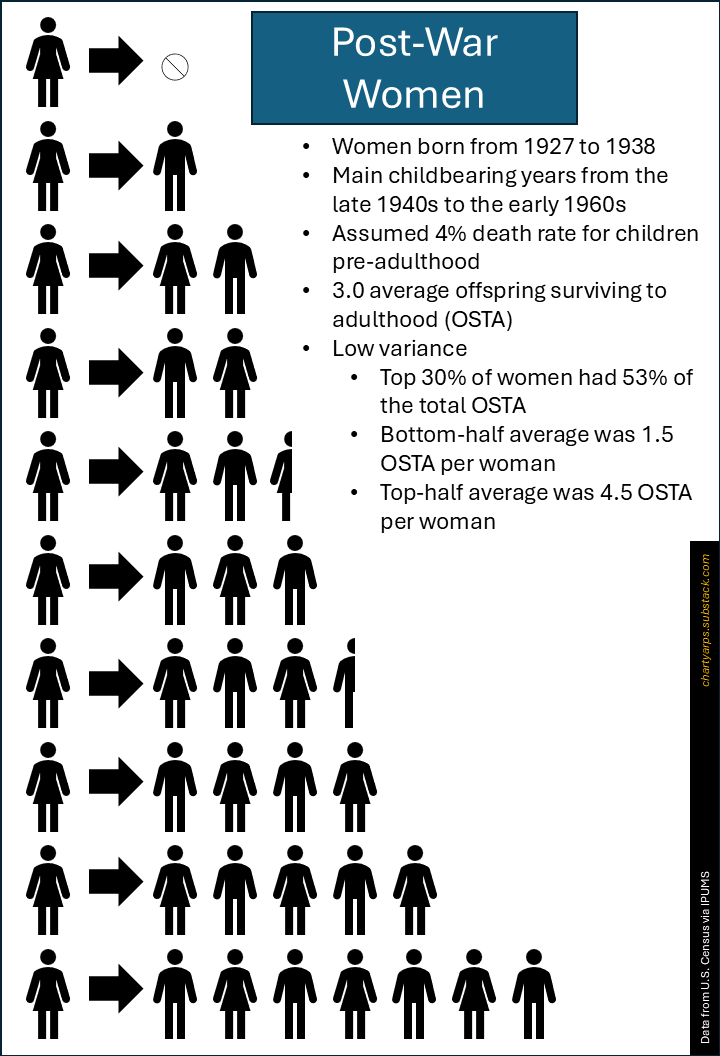
Next up are the mothers of the Baby Boomers. By this point, child death rates have only a marginal effect, reducing an average of 3.1 births (in my prior post) to 3.0 OSTA in the chart below. And, of course, the variance is essentially at the same low level. The top 30% had only 53% of the OSTA and the top half have only three OSTA for every one OSTA the bottom half ended up with. Only about one in ten women in this group had no OSTA.
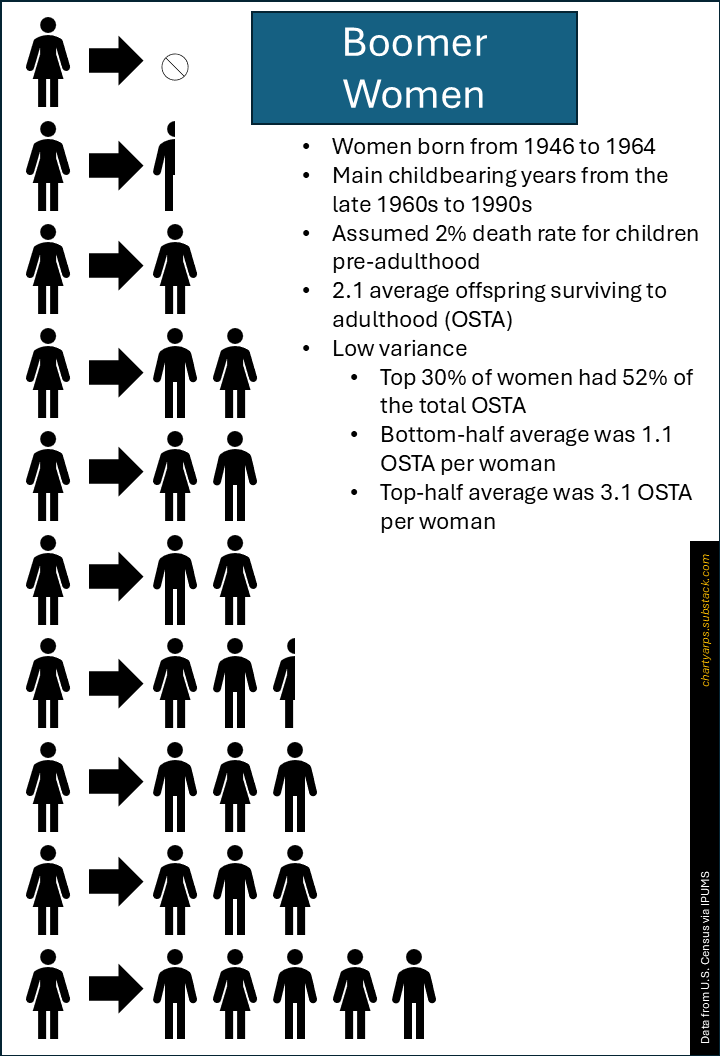
And, lastly, the Boomer Women below. They had 2.1 OSTA on average, with similar low variance as their mothers’ cohort had. Basically, the large bulk of women ended up with between one and three OSTA.
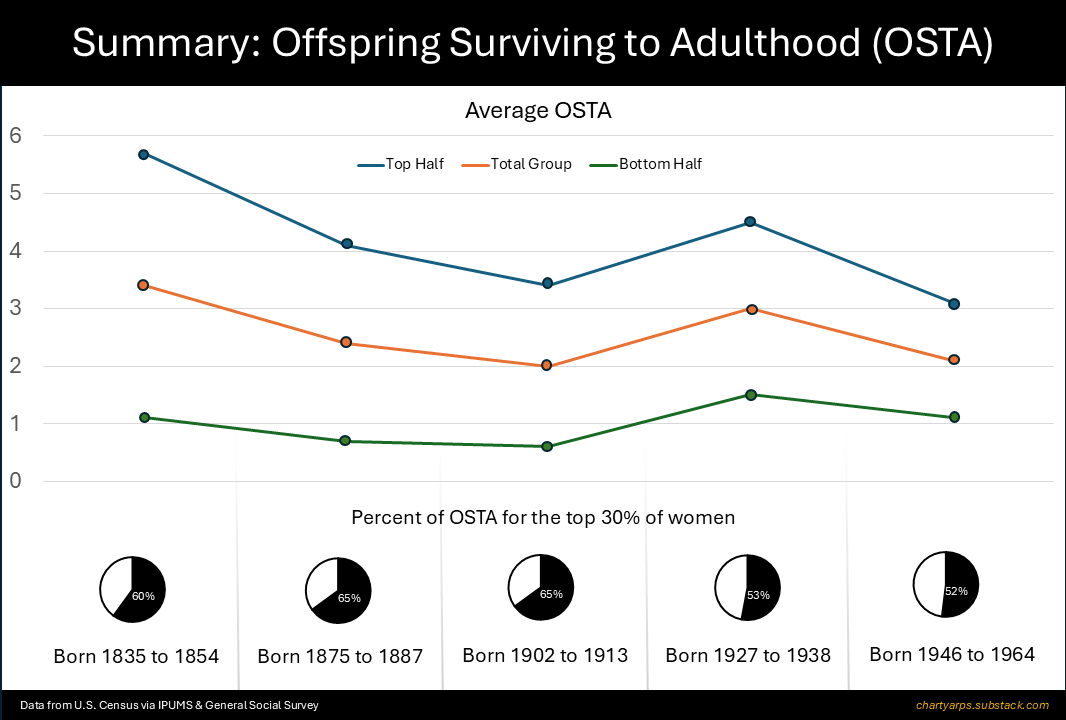
Here’s a summary chart. It shows, over our five cohorts, estimated average number of OSTA for the top half of each group (top blue line), the full group (middle orange line), and the bottom half (lower green line). By the OSTA measure, the averages have been declining for the top half (briefly interrupted by the post-WWII Baby Boom), but the averages have not been going down as a general matter for the bottom half. In fact, the bottom half of Boomer Women had the same average number of OSTA as did the bottom half of women born in the early-mid 1800s. The clearest trendline is that it has become a whole lot less common over this timeframe to see women having very large families (say, 5 or more kids).
I’ve obviously been thinking about current fertility debates, trying to get a clearer view of the basics. So far I think it’s safe to say: To the extent we’re talking about completed number of adult offspring in the U.S., the long-term trends aren’t particularly good evidence for any kind of dramatic downward shift. The long-term trends do point to periodic historical shifts both up and down that have been nearly impossible to predict beforehand. These shifts remain hard to explain even now, especially when you notice how differently distributed fertility has been in eras that had comparable overall averages—e.g., the Depressed Women had substantially higher within-group variance than Boomer Women, even though both averaged around two kids per woman. This should discourage strongly held views on future projections.
While pointing to long-term trends in completed fertility might not justify a view that something potentially worrisome is happening, there could be other evidence. It’s clear that we’re seeing total fertility rates (i.e., measures of all-age fertility at a given time point) that are lower than we’ve ever seen in lots of countries, so something is going on.
Further, there are early signs in the U.S. that Gen Z might be breaking the mold of prior generations. As I covered in a post a few months ago, if the recent National Survey of Family Growth data are an accurate reflection of that population, then we’re seeing unprecedented stuff there from the young folks that I don’t think anyone has a handle on yet – including a recent massive reduction in the proportion of young women saying they want to have kids someday. Having said that, this sample really might not be representative. It has become increasingly difficult to get good samples, especially of young people. This is part of the reason we keep seeing flatly inconsistent results from different surveys about youth political trends. It’s going to be super hard to get a clear view of these things.
When it comes to fertility analyses, my basic view is that we should be spending less time thinking about group averages and more time thinking about populations as being composed of different proportions of multi-faceted life patterns. This is part of why these last two posts have focused as much on distributions as on averages, to emphasize that this puzzle has more than one dimension. I think we have to figure out what drives diverse patterns that vary simultaneously in number of offspring produced, in relationship types (longer-term, shorter-term, monogamous, polygynous, polyamorous, etc.), in the earlier or later timing of relationships and childbearing, in socioeconomic status, and so on. We can then analyze societal-level changes over time as being driven by shifts in relative frequency of underlying component patterns. More on that later.