
A preliminary look at preliminary 2024 ANES pre-election data
It’s all very preliminary.

The American National Election Study (ANES) has now released its preliminary 2024 pre-election data from its survey of over 3,300 citizens in the Fall of 2024 before the election. Given the limits of the dataset, this isn’t going to allow a definitive take on what happened in that election—but it is another step forward in the long process of bringing a blurry picture into greater focus. While the dataset contains reports from a few early voters, it mostly contains reports from folks about their pre-election intentions with regard to voting. ANES also conducts a post-election survey of the same individuals, but those data aren't ready for release yet.
In this post, I’ll compare how the survey respondents said they voted in 2020 compared with how they said they were going to vote in 2024 (as recorded in the couple of months before the election). After playing around with the data for a while, I decided to split the sample by education and by majority/minority status. My “College” vs. “Non-College” split contains those who either have 4-year degrees or are full-time students on one side and non-students without 4-year degrees on the other. For my “Minority” vs. “Majority” split, the “Minority” category contains everyone who identified as a specific racial or religious or LGBT minority, including Blacks, Hispanics, Asians, atheists, agnostics, Jews, Muslims, Buddhists, Hindus, and LGBT folks. The “Majority” is everyone else, consisting predominantly of folks who are simultaneously white, Christian, and straight.
So that gives us four groups to compare: Non-College Majority, Non-College Minority, College Majority, and College Minority. The chart below shows Sankey diagrams for these groups, moving from the 2020 election to the 2024 election. There’s a lot to unpack.
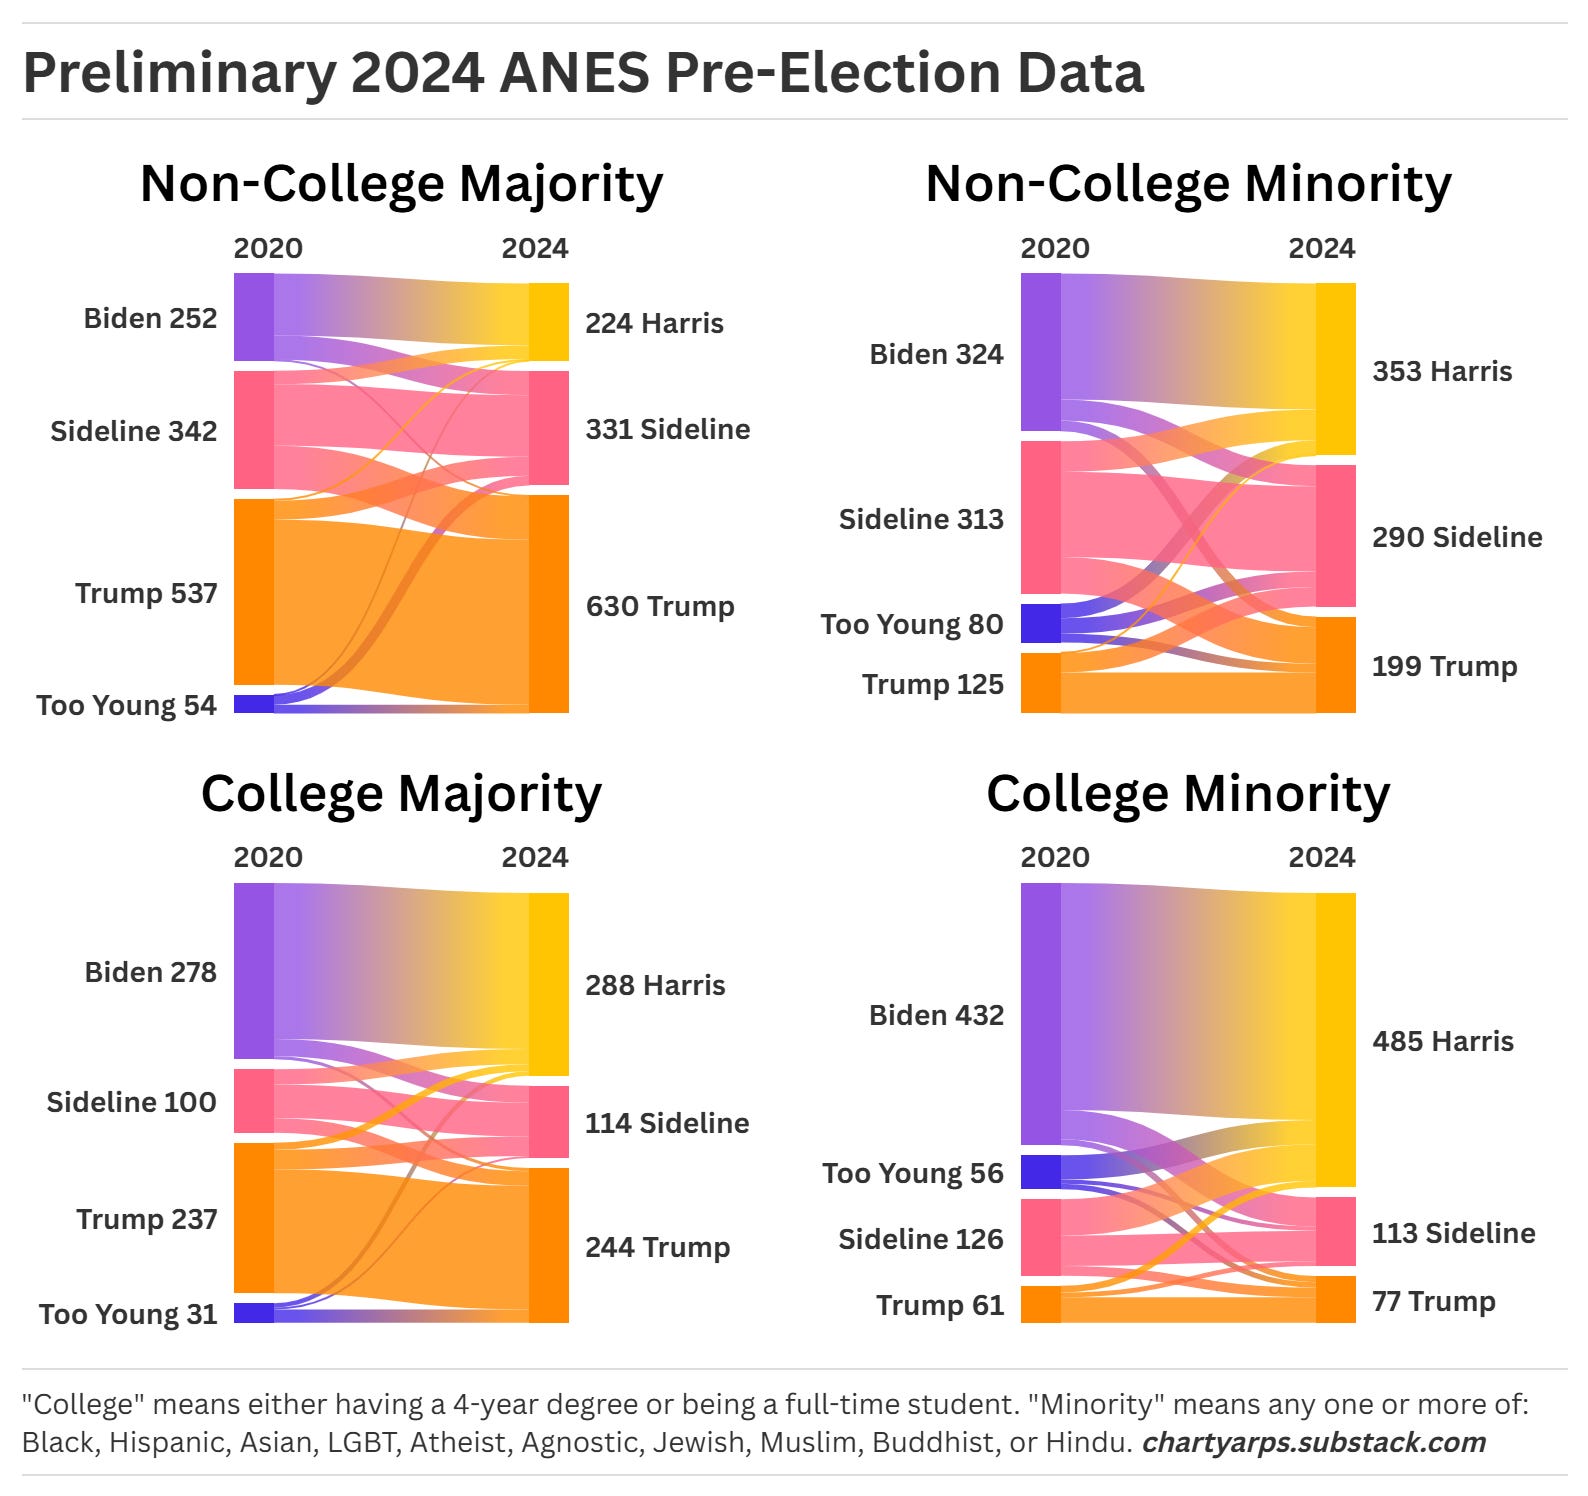
The numbers on the chart (other than the years) are the weighted number of respondents in each group. So, e.g., looking at the top left, there were 252 respondents who were members of the Non-College Majority group and who reported voting for Biden in 2020.
To figure out two-party vote share, just focus on the numbers for Biden and Trump (in 2020) and Harris and Trump (in 2024), ignoring the Sideline folks (who either didn’t vote or voted third party) and the Too Young folks in 2020 (who weren’t yet eligible to vote). You can see that Democratic support was highest among those in the College Minority group while Trump support was highest in the Non-College Majority group. The two-party vote percentages in this sample were as follows:
Non-College Majority: In 2020, 68% Trump vs. 32% Biden. In 2024, 74% Trump vs. 26% Harris.
College Majority: In 2020, 54% Biden vs. 46% Trump. In 2024, 54% Harris vs. 46% Trump.
Non-College Minority: In 2020, 72% Biden vs. 28% Trump. In 2024, 64% Harris vs. 36% Trump.
College Minority: In 2020, 88% Biden vs. 12% Trump. In 2024, 86% Harris vs. 14% Trump.
This sample is suggesting that, at this stage before the election, Harris seems to have been losing ground relative to Biden particularly among the non-college groups (both Non-College Majority and Non-College Minority) while holding right around Biden’s support levels among the college groups (both College Majority and College Minority).
There are tons of other observations one could make on what’s presented in the diagrams. For example, notice that most of the change from one election to another is not about switching parties, but instead from potential voters moving on and off the sidelines. Also notice that there are more non-college folks on the sidelines (as I discussed in a recent post).
The youngest voters have gotten a lot of attention this cycle. The diagrams separately show those who came of voting age between the 2020 and 2024 elections, i.e., the folks labeled “Too Young” in 2020. There were only a bit over 200 of these very young folks in the sample—enough to start thinking about plausible hypotheses, but not enough to draw any conclusions. Among the Too Youngs in 2020, it looks to me like those in the Majority groups broke significantly more heavily towards Trump in 2024 than their demographics would otherwise suggest. It’ll be interesting to see what the ANES post-election data and the Cooperative Election Study say about that point. Notice as well that, among those very young adults, the “Minority” group has become a majority—Gen Z contains not only more Hispanics and Asians than older generations, but also more non-religious and LGBT folks, collectively well outnumbering straight White Christians.
I’ll leave it there for now, but here’s a couple of closing notes.
Where are the women (and men)?
Lots of folks seem especially interested in the gender gap, so I’ll cover that briefly. The 2024 ANES data so far do suggest that the gender gap grew in 2024 relative to 2020. But the thing to keep in mind is that the gender gap overall is not now, nor has it ever been, a big deal in general. In the 2024 ANES sample, Harris was expected to get a little over 59% of women’s two-party votes, as compared with a little over 48.5% of men’s votes—so that’s a 10 or 11 point gap. By way of comparison, the ANES sample shows a 17-point White vs. Hispanic gap, a 30-point college vs. non-college gap, a 31-point Heathen* vs. non-Heathen gap, and a 42-point White vs. Black gap. The gender gap is far from the gappiest gap.
*I use the term “Heathen” to refer to those who are LGBT and/or explicitly non-Christian.
What about the conservative Gen Z men?
I did a post on how I couldn’t find the big new political gender gap among young people that we keep hearing so much about. I was using data collected through 2023, and while you could maybe see the youth gender gap increasing a bit over the past few years, it hadn’t yet turned into anything unusual or noteworthy. Well, here’s my first 2024 data, and it’s not showing up here either. Instead, the ANES 2024 pre-election data are pointing to a really big Boomer gender gap (19 points), with Gen X pretty narrow (5 points) and Millennials and Gen Z in between (at around 9 points).
Now, that doesn’t mean it’s not true. These data come from a couple of months before the election, so maybe in the end there was an unusually large gender gap in Gen Z. It would be fun and interesting if that were true, I guess. But, you know, I’m still skeptical.