The Basics of U.S. Fertility
A big-picture look at large-scale patterns across cohorts, current trends, and drivers of individual differences.

I’ve been taking a close look at fertility patterns in the U.S. and I think I’m at a good point to draw together some key lessons. I’ll start with the big picture on how fertility patterns have changed in the U.S. over the longer term, then I’ll zoom in on more details regarding the most recent several decades. After that, I’ll discuss the major factors that together drive current individual differences in fertility. I’ll conclude with a discussion of some of the various elements ultimately driving our changing fertility patterns. In this post, I’m mostly just trying to get the major descriptive story right.
Women born from the 1830s to the early 1910s
This chart shows some key points regarding historical fertility patterns in the U.S.:
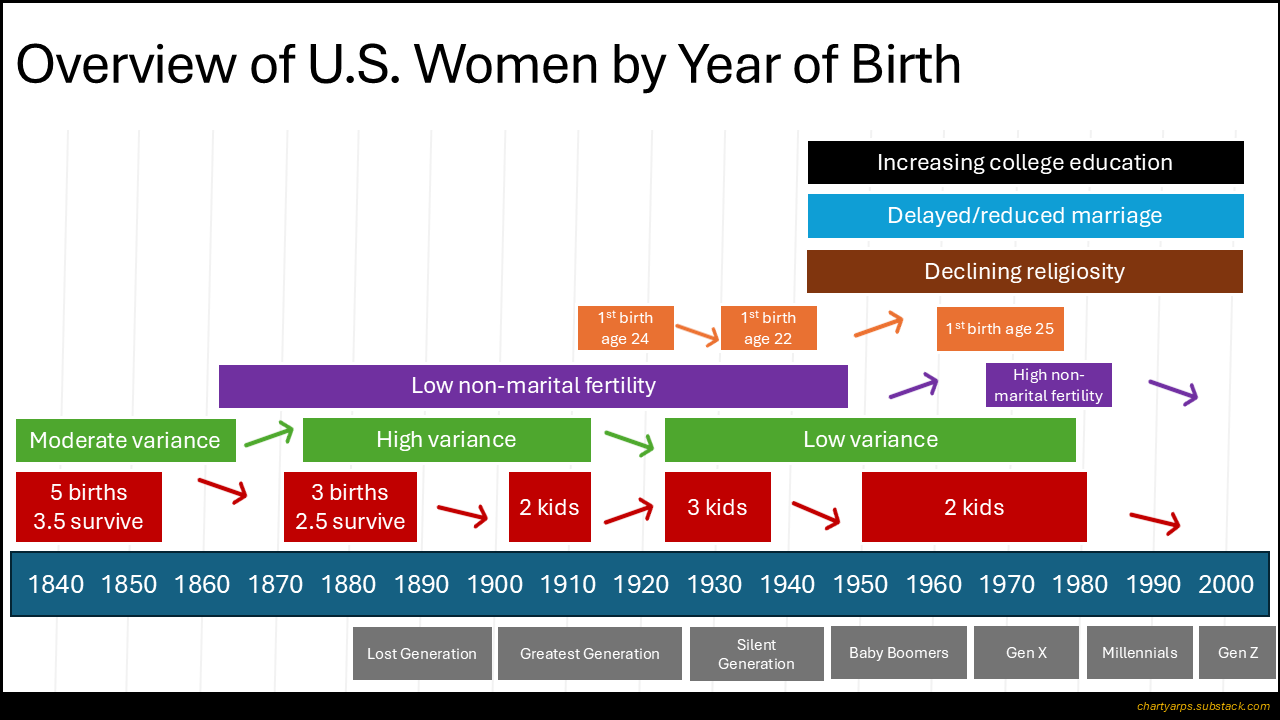
Going from left to right, in the pre-industrial age, women tended to have lots of kids but then lots died in childhood. So, in the big picture above, you can see that, for U.S. women born in the mid-1830s to mid-1850s—who had most of their children prior to the invention of the light bulb—my analyses suggest they had around 5 births on average, with an average of around 3.5 surviving to adulthood. For those born in the decade and a half after, number of births fell but survival rates increased as well, such that, when we get to women born from the early-1870s to the late-1880s, having the bulk of their kids from the early 1890s through the first decade of the 20th century, U.S. women on average were having 3 kids, with 2.5 surviving to adulthood.
Fertility continued to fall with rising offspring survival rates for women born up through the end of the 19th century until fertility rates bottomed out for women born from the early 1900s to the early 1910s. I’ve referred to this cohort as the Depressed Women, given that they had most of their children in the 1920s to early 1940s, a period dominated by the Great Depression. They had a mere 2.2 births on average and 2.0 children surviving to adulthood. So, for U.S. women born from the late-1830s to the early-1910s, the story generally is one of declining fertility, whether measured by number of births per woman (falling from 5 to 2) or by number of offspring surviving to adulthood (falling from 3.5 to 2).
As average fertility was falling over this period, variance in completed fertility was rising. That is, it wasn’t the case that these fertility declines resulted from everyone having fewer children. Rather, the late-19th and early-20th century fertility decline resulted from more of a feast or famine situation. Compare the Depressed Women to the Baby Boomers born from 1946 to 1964, who, like the Depressed Women, averaged around 2 children. Though their average fertility levels are very similar, the distribution of fertility was importantly different. The Depressed Women had a high variance pattern where the lows were very low (e.g., around a quarter of women ended up having no children) and the highs were very high (e.g., the top 10% had around 7 children each). In contrast, the Boomer women maintained a low variance pattern, with only around 15% having no children while the top 10% averaged around 5 per woman. Looked at another way, over half of Boomer women ended up with 2 or 3 kids. For the high-variance Depressed Women, this 2-to-3 middle-ground contained only roughly a third of women.
Women born from the 1920s to the early 1980s
Now we’ll zoom in on the part of the story we’re all more familiar with. I’ve clipped below the latter half of the big picture we started off with above. These are the generations we know by name. The modern story typically begins with the Baby Boom, when fertility rose after WWII and stayed high until falling back down during the Sexual Revolution of the 1960s and 1970s. The peak baby makers were the women born from the early-mid-1920s to the late-mid-1930s. They averaged 3 children with a low variance pattern; only around 10% had no children and the middle 60% had between 2 and 4 children.
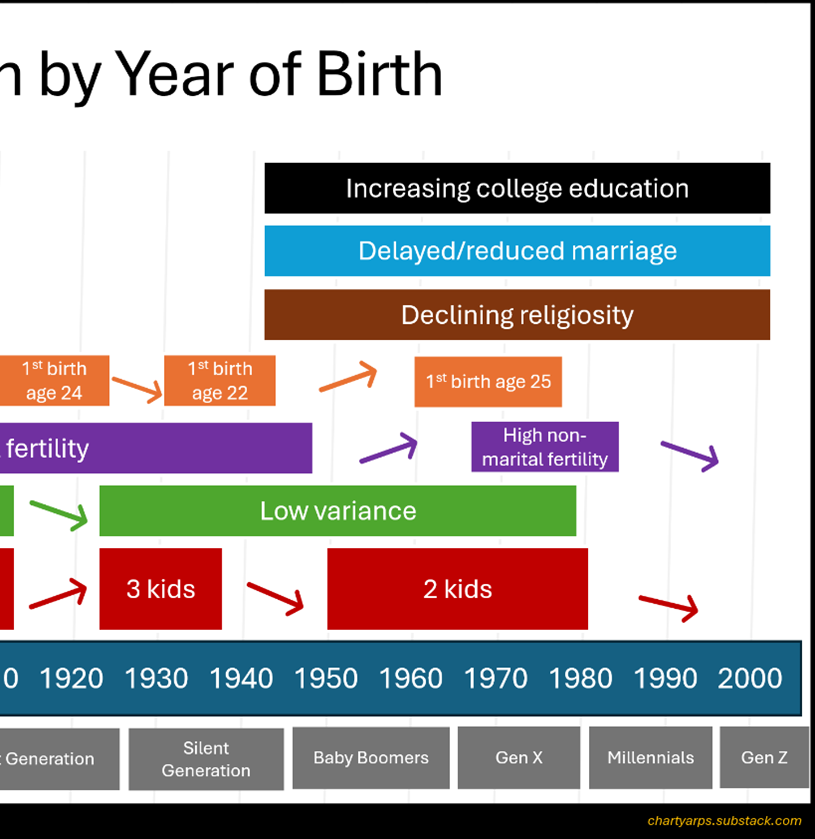
The post-WWII Boom-making women had a number of key characteristics that have remained associated with higher fertility throughout the modern era, including low levels of college education and workplace participation, high marriage rates that started young and where divorces were relatively infrequent, and higher rates of religious identification and service attendance. But they also maintained one key feature that reduced overall fertility, namely, low rates of non-marital childbearing. This hardly mattered overall, though, as marriage rates were at historic highs.
Their children are called the Baby Boomers, who are the products of the post-WWII boom. Boomer women kicked off an extended period of change in the fundamental social patterns surrounding U.S. fertility. From the Boomer women all the way through Gen Z women (born in the late1990s and 2000s), (1) women’s college education rates have risen in every generation compared with the prior one, (2) marriage rates have fallen, with a particular decline in marrying at younger ages, and (3) levels of religiosity have fallen.
For women born around 1950, between 20% to 25% had a 4-year college degree by age 30. For the women born around 1980, this grew to between 35% and 40%. For women born around 1950, approximately three in four were married at age 30. For women born around 1980, this dropped to around 55%. Close to a third of women born around 1950 went to church weekly at age 30, and fewer than 10% didn’t identify with a religion. For the 1980 cohort, fewer than a quarter were weekly churchgoers and about 20% didn’t identify with a religion.
The wild thing here is that, while these central patterns were moving consistently in a direction that would predict lower fertility—women were spending more adult years pursuing formal education, they were marrying later and less often, they were drifting away from religion and service attendance—despite all that, for a long time, overall fertility rates actually remained roughly flat. Women born around 1950 had about 2 kids. So did women born around 1960. And women born around 1970. And women born around 1980.
The main thing keeping overall fertility stable even in the face of such fundamental increasing headwinds was something almost no one was lobbying for and few applauded: the rise in numbers of children born to unmarried women. Through the Boomer and Gen X years, non-marital fertility increased, peaking with women born in the 1970s. If we look at women who had never been married and had not gotten a college degree by their early 40s, those born in the 1940s and 1950s ended up averaging right around 1 child per woman. For those born in the 1970s, this rose to roughly 1.6. Never-married women with college degrees increased their fertility quite a bit as well, going from an average of about 0.15 children per woman for the 1940s and 1950s cohorts, up to around 0.55 for the 1970s cohort. Marital fertility also rose over this time period, though not by very much.
Remarkably, the pace of the rise in fertility within education/marriage subgroups (especially for unmarried women) pretty closely offset the flow of women from more fertile subgroups to less fertile ones for almost 30 years, a period encompassing women born in the early 1950s through the early 1980s, resulting in pretty flat overall fertility at around 2 kids per woman.
Women born from the mid-late 1980s to the 2000s
The long period of complex stability in overall fertility rates has now ended. It’s increasingly clear that we’re in another period of overall fertility decline. Some key factors at play are the continuing rise of education levels and delay/decline in marriage rates, coupled with a recent dramatic decline in births to women in their teens and early 20s, a decline particularly sharp for young unmarried women who are no longer in school.
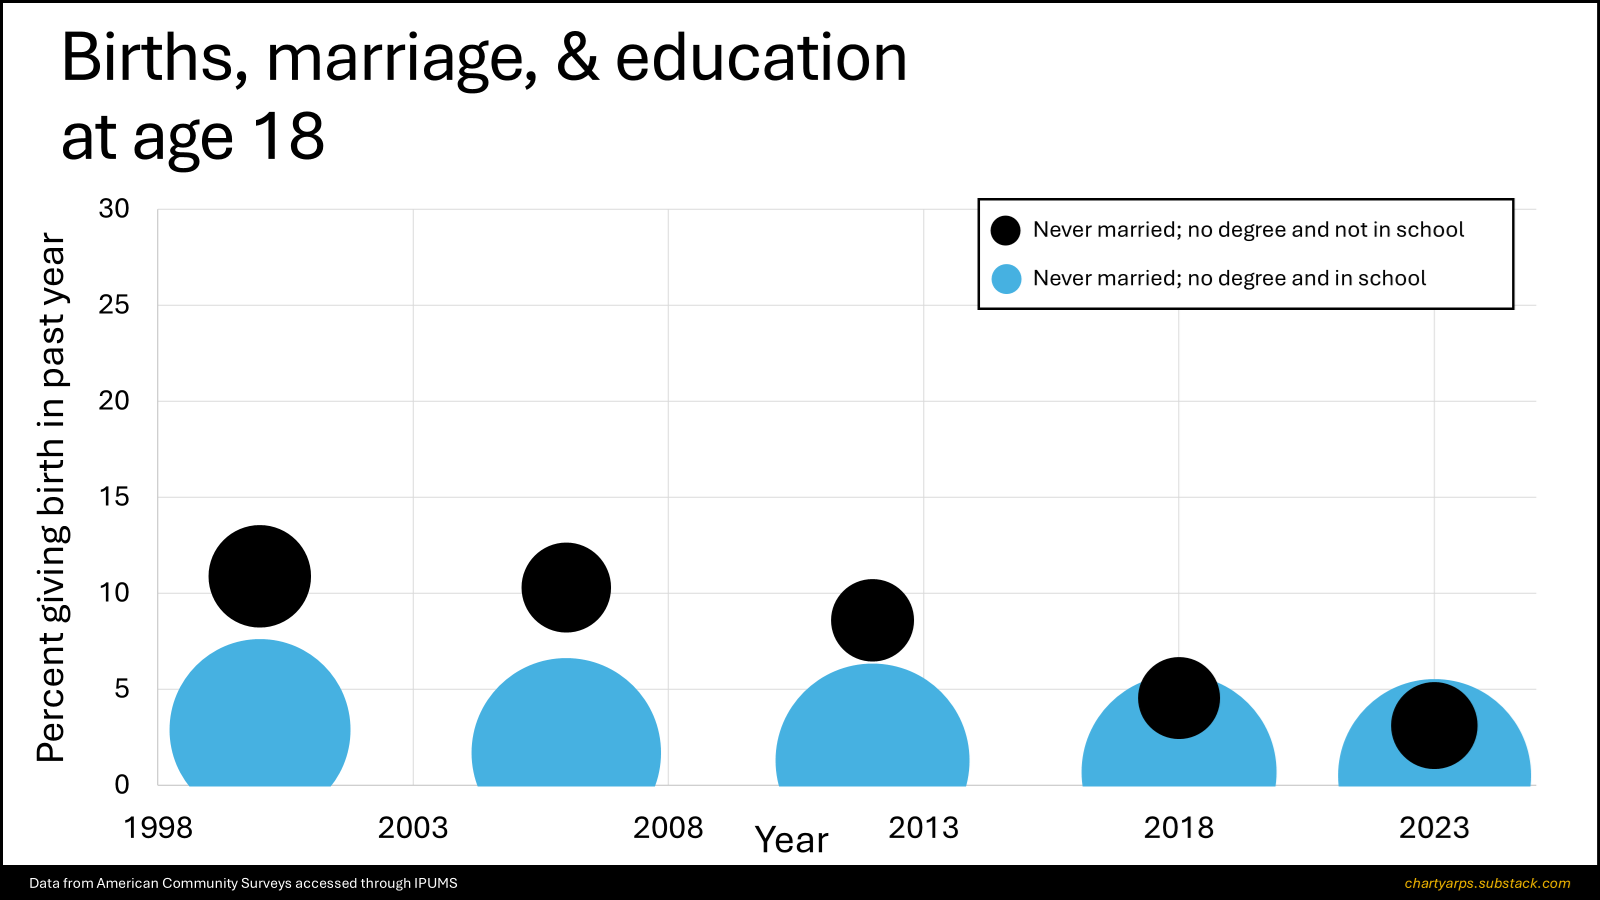
The two charts below show the recent trends. For 18-year-old women in 2000 (these are early Millennials born around 1982), if we look at those who have never married and are no longer in school (the black circles on the chart below), around 11% had given birth in the past year. Move forward to 18-year-old women in 2023 (these are at the center of Gen Z born around 2005), and only around 3% had given birth in the past year). Births to never married 18-year-olds who were still in school (the blue circles) fell as well from around 3% for the early Millennials down to less than 1% for middle Gen Z.
The next chart shows 22-year-olds, where again the main story is the decline in fertility among those who had never married and who left school without having earned a college degree (the black circles). For 22-year-old women in 2000 (late Gen Xers born around 1978), 13% had had a child in the past year. Go forward to 2023 (Gen Z women born around 2001), and this has dropped to around 6%.
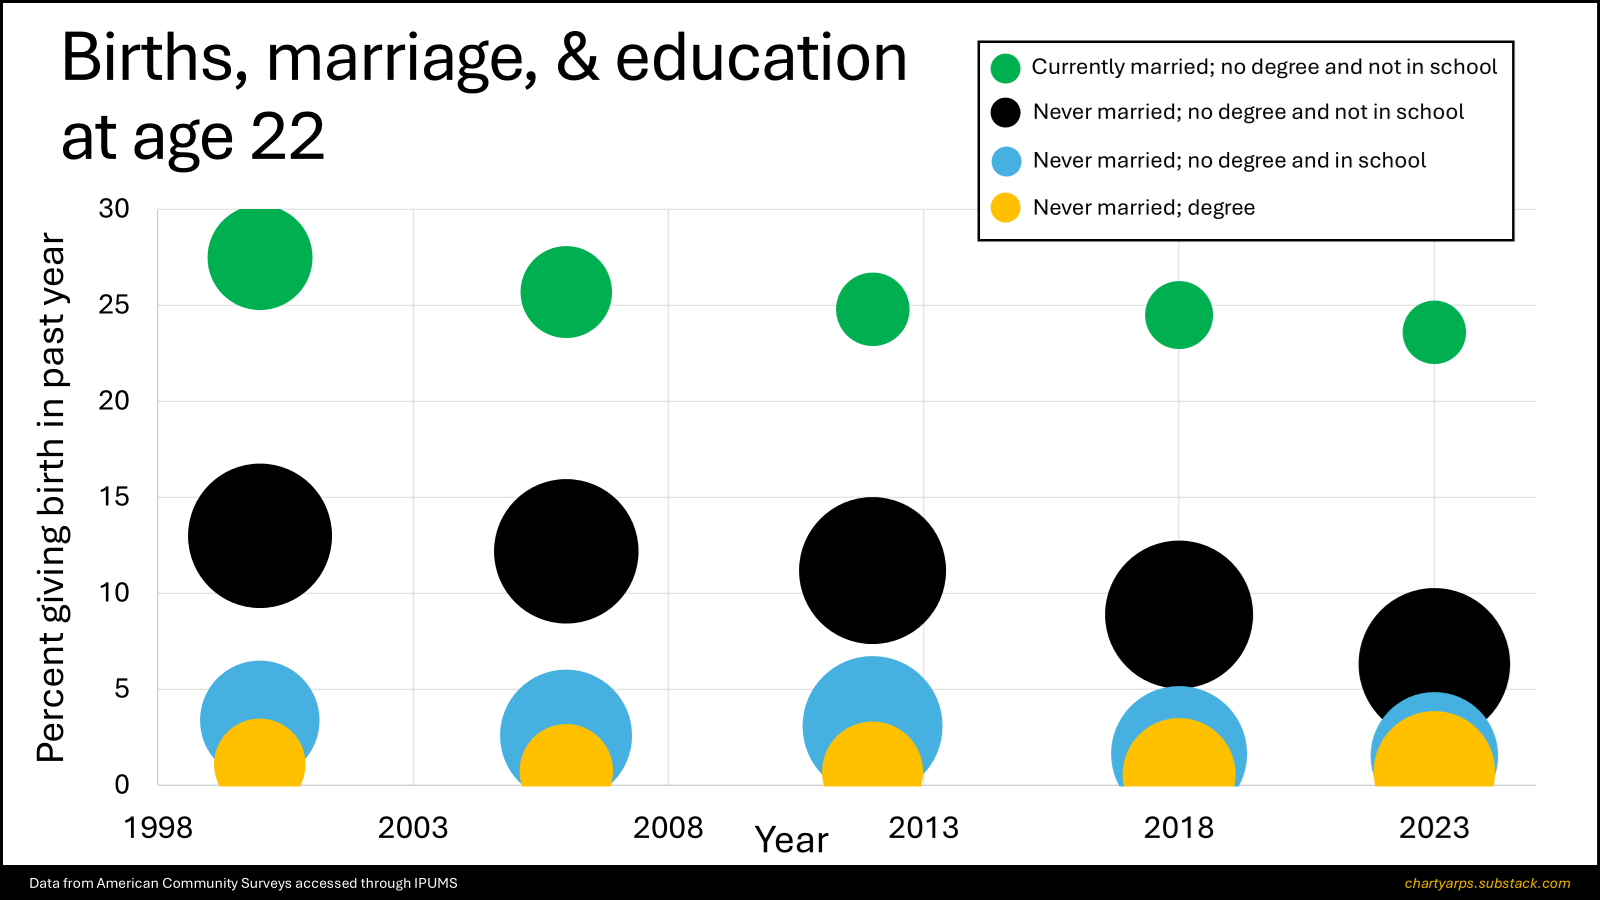
During the period from 2000 to 2023, these kinds of strong within-subgroup declines were mostly limited to the youngest women. Comparing women in their mid-late-20s and older, the period from 2000 to 2023 saw a lot of movement away from less education and more marriage and towards more education and less marriage. But if you look within college-educated married women, or within non-college never-married women, etc., the within-subgroups fertility trendlines for these older women have been pretty flat over recent years.
And so, the immediate causes of our current dip in fertility? It’s partly a continued general shift towards education and away from marriage, along with a sharp drop specifically in the fertility of women in their teens and early 20s, and especially among never-married young women who are not in school.
Individual differences in modern U.S. fertility
In exploring the large-scale population-level changes over time, we’ve seen a number of individual-difference items in play. Let’s get more systematic on that.
I’ve spent a lot of time with the National Longitudinal Survey of Youth 1997, which has repeatedly surveyed a group of early Millennials since 1997 when they were mostly in their teens. When looking at education, income, alcohol/drug usage, sexual activity, cohabitation, marriage, number of kids, timing of kids, and church attendance over their lives from their teens to late 30s, three big more-or-less-independent factors help make sense of the complex underlying patterns.
One is the contrast between the patterns of women with low socioeconomic status (SES) and those with high SES. This factor is predominantly about the role of higher education in delaying major life events and reducing fertility. On the one side are women with more education. They have higher incomes, fewer children in their 20s, fewer non-marital cohabitations, and more marriage in their 30s. On the other side are women with less education, lower incomes, more children in their 20s, more non-marital cohabitations, and less marriage in their 30s. Women’s positions along this contrast are strongly predictable based on things like parental income, high school grades, and standardized test performance.
Another is the contrast between what I’ve called Freewheelers and Ring-Bearers. On the Freewheeler side, you see more alcohol/drug usage (aka partying), less church attendance, more non-marital cohabitations, more sex partners, and fewer kids. On the Ring-Bearer side, folks don’t drink or use drugs much, they go to church more, avoid non-marital cohabitations, have fewer sex partners, and more kids. Positions on this contrast are moderately predictable based on parental church attendance.
And, finally, there is the contrast between what I’ve called Participants and Sideliners. Participants are actively in the (heterosexual) game during most of their reproductive years. More marriage, more likely to be sexually active, more children, more non-marital cohabitation. Sideliners are not so in the game. Less marriage, less likely to be sexually active, fewer children, less non-marital cohabitation. A key demographic split here is that Black women were substantially less likely than others in this cohort to have married. I suspect this is in large part driven by the relatively high percentage of Black men who were incarcerated or dead when these women were at peak relationship ages. That kind of sex ratio imbalance can widely destabilize long-term monogamous relationships within a population.
These three fundamental organizing factors each play out simultaneously to drive complex individual differences. A low-SES Freewheeler pattern looks different than a high-SES Freewheeler pattern. A high-SES Ring-Bearer Sideliner pattern looks different than a high-SES Ring-Bearer Participant pattern. And so on. Moreover, some people switch patterns over their lives. Two common examples that probably look familiar: One is what I’ve called a Mixer pattern, which is when a Participant starts off with a mostly Freewheeler pattern (which begins very early in its low-SES version and in late high school or early college in its high-SES version) and eventually switches to marriage and children (again, earlier or later based on SES). Another is a mid-to-high SES Ringbearer pattern, which starts off as a heavy Sideliner pattern and switches to a heavy Participant pattern when they marry (usually marrying at younger ages than other mid-to-high SES women).
How some of the pieces fit together
To me, a satisfying explanation in the kinds of social science questions I work on comes from putting together a good number of the big pieces of the puzzle, where those pieces themselves are pretty well understood. The key is to find the sweet spot between explanations that are trivial and those that are really big deals yet essentially create equivalent mysteries to the ones they’re supposedly solving. Examples of the trivial: When explaining fertility differences, sometimes analysts will really zero in on something like the relative participation of marriage partners in household chores or the availability of parental leave. At best, these kinds of factors might relate to a tiny fraction of the explainable variance. They’re just not important.
As for explanations that are too good to be useful, these are typically going to be accounts that say, you know, the reason people started having fewer kids over a given period is because they stopped wanting as many kids, or because societal norms were shifting away from large families—and then the person just stops as though they’ve explained it. OK, but why did they stop wanting to have kids? Why were societal norms starting to favor smaller families?
Attributing falling fertility to falling marriage rates is almost in the too-good-to-be-useful category, though I would say it’s ultimately important to emphasize the close connection. But it’s also important to point out that this can be a case of simply exchanging one hard problem (why does fertility vary as it does?) with an essentially equally hard one (why do marriage rates vary as they do?).
For the time being, here are some things I’m pretty comfortable saying:
Education and marriage are two big initial things that help make sense of U.S. fertility patterns over the past several decades. But then we’ll need more-satisfying accounts of why educational and marital patterns have been changing.
The primary effect of higher education in this space is that it delays marriage and childbearing. These delays have typically resulted in, somewhat paradoxically, more and more-stable marriages for educated folks as they go through their 30s and 40s, but ultimately fewer children in the end (largely due to the fact that they sat out their most physiologically advantaged childbearing ages). As for what’s causing education rates to rise, it seems plausible to me that it’s coming from a number of sources, including (1) an increase in the proportion of valuable jobs for which college credentials are helpful, (2) a status-seeking arms race, and (3) a hedge against risk of divorce.
The substantial causes of the marriage decline are likely to include: (1) delays caused by increased higher education and (2) a relative rise in the importance of male sexiness as compared with male provisioning and stability in women’s mating decisions, especially for women who don’t pursue higher education. More on that some other time.
The role of religiosity in all this is complex, in large part because you have to take seriously that lots of people choose the extent to which they become or remain religious as a downstream effect of wanting to maintain a Ring-Bearer lifestyle (little partying, fewer sex partners, committed relationships, more kids). I’ve discussed this at greater length in other posts, e.g., here.
The Baby Boom was a really odd period—the only period in at least 200 years in which overall U.S. fertility rose substantially. Something like that is likely not to have just one big cause, but multiple things going on at once. We have some good candidates for what some of those contributing causes might be, but I’m skeptical of attempts to put too much weight on any one of them. Personally, I think the major factors included: Pent-up demand for children by those who had put it off in the Late-Depression and WWII years; low college attendance rates for women; a pretty good economic situation at least as measured by things like growth rates and the unemployment rate; the fact that men didn’t vary so much in wealth and income as they did before and after (e.g., the 1940s and 1950s were a peak period for the percentage of workers in labor unions); an improving male-to-female sex ratio at peak reproductive ages, which rose slowly from the mid-1940s through 1960 (before falling fast and far from 1960 to 1970, which is, I think, an understudied candidate for the prime mover of the Sexual Revolution). I’ve heard smart people talk about the role of technology changes (e.g., all the core household appliances being adopted from the 1930s to the 1960s—refrigerators, stoves, vacuums, washing machines), though I’m not understanding why those would be a major cause of a temporary rise in fertility. In contrast, the kinds of things I’m pointing to were present in the Baby Boom years but not as true before or after that period. All this points to a conclusion that we’re very unlikely to repeat something akin to the Baby Boom any time soon.
Something different is happening in recent years. I don’t think anyone has a handle on it yet, and it’s muddied by problematic declines in the availability of representative survey samples, particularly for young people. I presented a bunch of details from the most recent National Survey of Family Growth here, including young women having more sex partners and being less religious than young men (which as far as I know has never before happened in the U.S.), as well as just a big rise in Sideliners (i.e., more people not really participating in heterosexual relationships and not wanting to have kids at all), something we probably haven’t seen at least since the Depressed Women of the early 20th century.
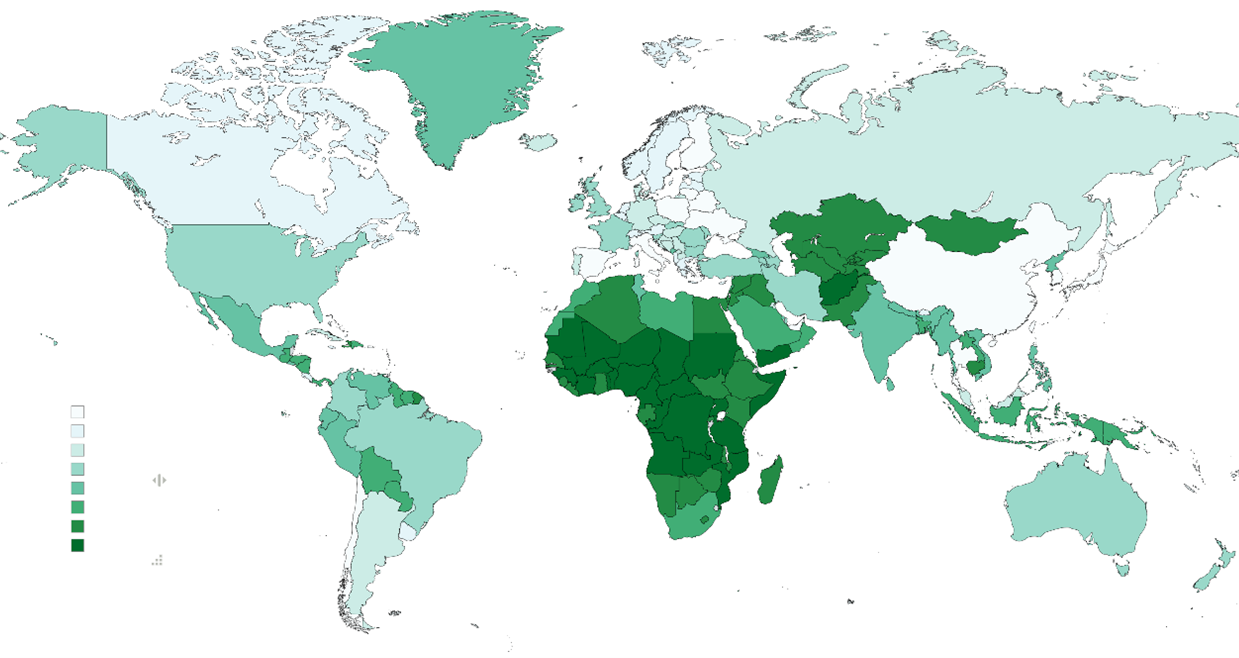
I’ve been talking only about the U.S., but it’s clear that major shifts are occurring around the globe. This ought to nudge us towards the kinds of explanations that aren’t too country-specific. Some of these will be about new stuff fueled by globalization, such as widespread technological shifts or interconnected economies. Some of these will be about very old stuff—sorting out how our shared evolved brain-wiring developmental mechanisms interact with past and current cultural/ecological conditions. This is incredibly difficult terrain, but we’ll continue to make progress in understanding it.